


Winnipeg Home Price Index Update - Data From July 2024
Welcome to August! Summer is here, the weather is hot, and we've just experienced our first "down" month of 2024. What's next for Winnipeg real estate?
After a second interest rate cut, a heat wave lasting several weeks, and all-around strong market activity, the results are finally in for July 2024! Results are overall strong compared to previously calendar year July’s, and are only slightly below our very strong June market report. Details below.
A podcast version of this update will be available on Aug 6th 2024. As always, if you find these updates helpful, please subscribe (it’s 100% free and always will be!)
July 2024 HPI Update
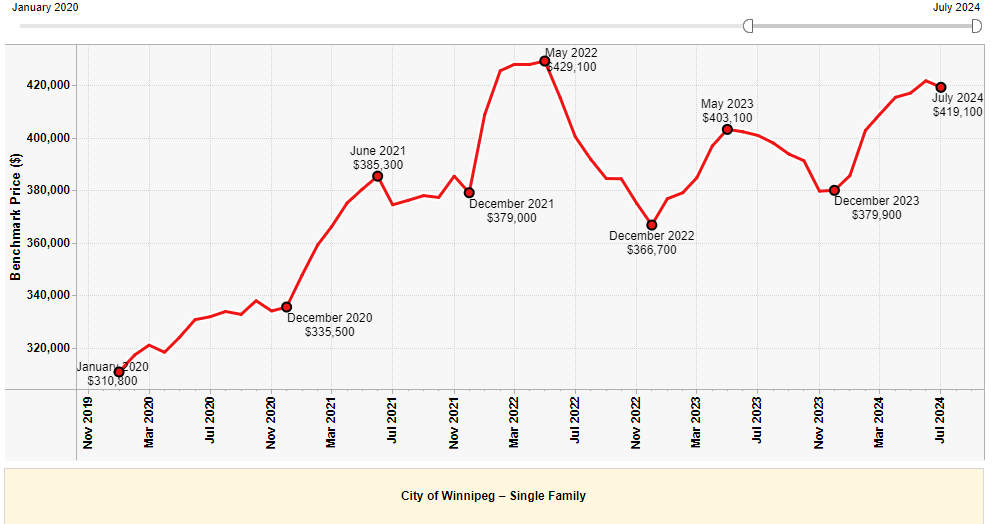
July Winnipeg Benchmark Price: $419,600 (down from $421,600 in June))
Year to date: +10.45% (Was +10.98% last month)
Month over month: -0.47% (Was +1.13% last month)
From All-time High: -2.21% (Gain of +2.27% required to return to ATH from here)
The July data is out, and things are looking quite good! The shift away from 1%+ monthly gains should come as no surprise to monthly readers of this Substack - We’ve hit the dog days of summer, and seasonality is starting to kick in. Despite this, after I posted teaser charts on social media one day before the release of this article, I was very surprised to see the public reaction to a -0.47% benchmark price reduction being slightly fearful and generally negative. I currently have less than 450 Instagram followers, and I had 10 separate people DM me asking about the implication of the reduction in the benchmark price. I’d consider this to be a lot of people given the relatively small pool I’m reaching.
I was a bit surprised to see this. I considered I may have baited a response by posting a purposefully goofy photo of myself staring bewildered at my phone with the HPI chart on screen, and this may have driven some fear. But after reviewing the data and thinking carefully about the general attitude towards the real estate market across the country, I think there’s more too it than that.
We haven’t seen a decline in the benchmark price since November 2023, and we’ve generally experienced 1-3% monthly gains from that time until precisely right now. This is not what has happened in other parts of Canada, with some neighborhoods on the far reaches of the GTA falling back down to pre-2021 pricing levels.
Additionally, the long-awaited interest rate cuts have finally started, which I think may have created some ambitiously high expectations for real estate markets across the country.
Considering the stable supply picture, the strong absorption numbers, the high average sale price, and the stable & high transaction volume, it’s really hard to see how anything BUT a seasonal shift in the market has begun to occur. It remains my opinion that the Winnipeg benchmark price will continue to slide modestly into the Fall and Winter season, leaving us up a total of ~5-8% on the year by the Dec 2024 data point.
Additionally, expect any further interest rate cuts to have minimal effect on the market in the immediate term, as transaction volume and listing/buying activity generally tapers into the late part of the year. That being said, definitely be prepared for these expected further interest rate cuts to trigger an even more explosive Spring market in 2025.
SUPPLY July 2024:
June 2024 Data:

July 2024 Data:
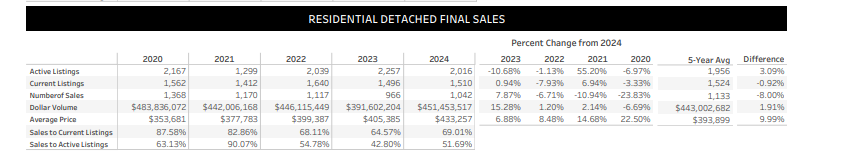
Looking at the July data, the supply situation is remarkably similar to the June data, with 2016 active listings right now vs 1994 in the previous month. While transaction volume fell from 1128 in June to 1042 in July, the number of transactions compared to prior July’s is looking excellent, sitting far above the numbers from 2023 and remaining reasonably close to both 2021 and 2022.
Both dollar volume and the average sale price fell month over month, but both metrics are significantly higher year over year. Additionally, the average sale price for detached homes in July, which came in at ~$433,257.00, remains HIGHER than the current benchmark price - a strong indicator prices could be rising in the near future. Considering the time of year, I do not expect this to transpire, but I do think this gap should slow the rate decline into the Fall market.
Absorption Data:
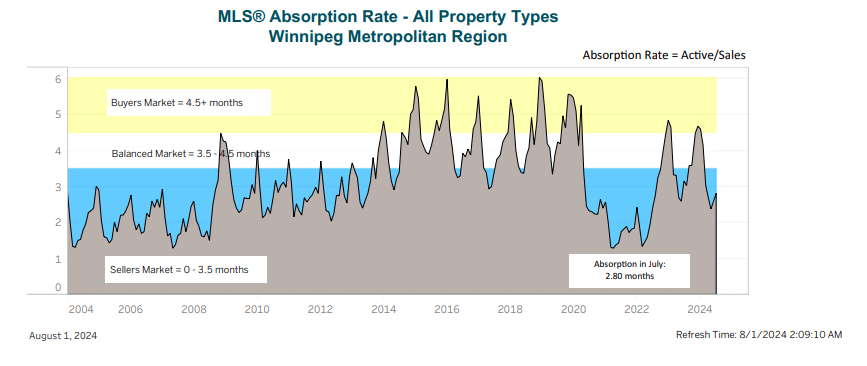
The July absorption data for the entire City of Winnipeg is extremely similar to what we saw in June: a slight push back into the buyer favored territory but not by much. The market as a whole is still generally very seller favored, however different price points, areas, products and types of real estate can differ very dramatically in terms of buyer appetite. Always talk to your agent about listing strategy for your own specific property before making any specifics decisions about pricing or marketing!
BIDDING WARS - OVER OR UNDER
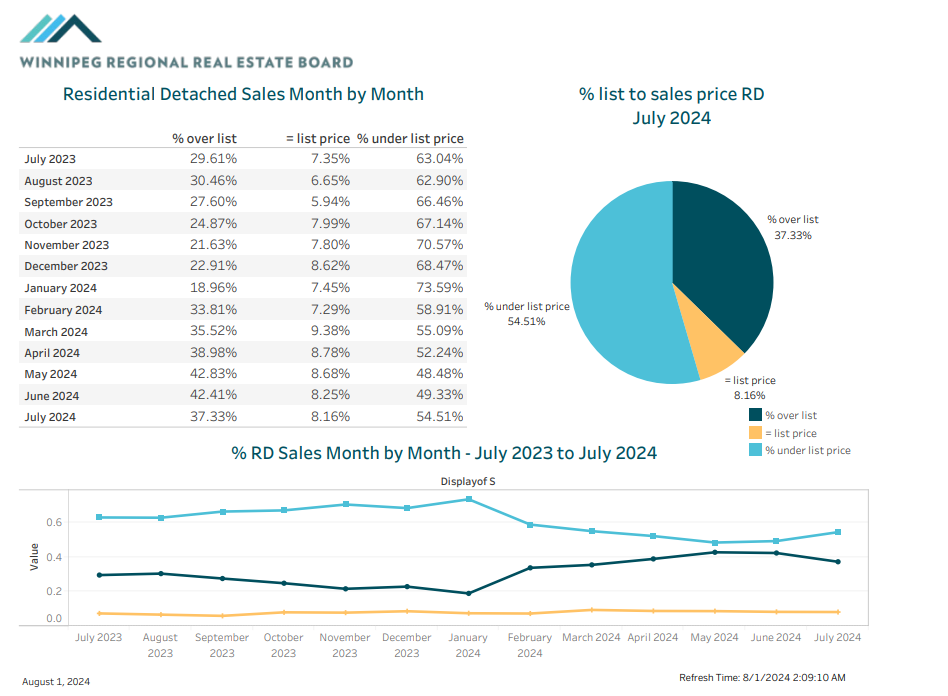
July saw the first significant divergence in the prevalence of the bidding war strategy citywide, with approximately ~45.5% of homes selling at or above asking as opposed to nearly ~51% in June. This rate is fairly similar to what the market experienced in March of this year, with the difference being some areas specifically can succeed wildly with a listing strategy to seek multiple offers while other areas simply do not have the activity available to support such a strategy.
On a year over year basis, far more listings are selling over the asking price this July than last - which is mostly a testament to strategy, but it is also a great indicator that we may not be as deep into the “dog days of Summer” market at this point in 2024 as we were in 2023. Working off of strictly personal feeling, I would say this July felt more similar to late May early June 2023 than it did to July 2023 in terms of urgency, pricing strategy, and general level of buzz the market was experiencing.
SALES BY AREA REPORT


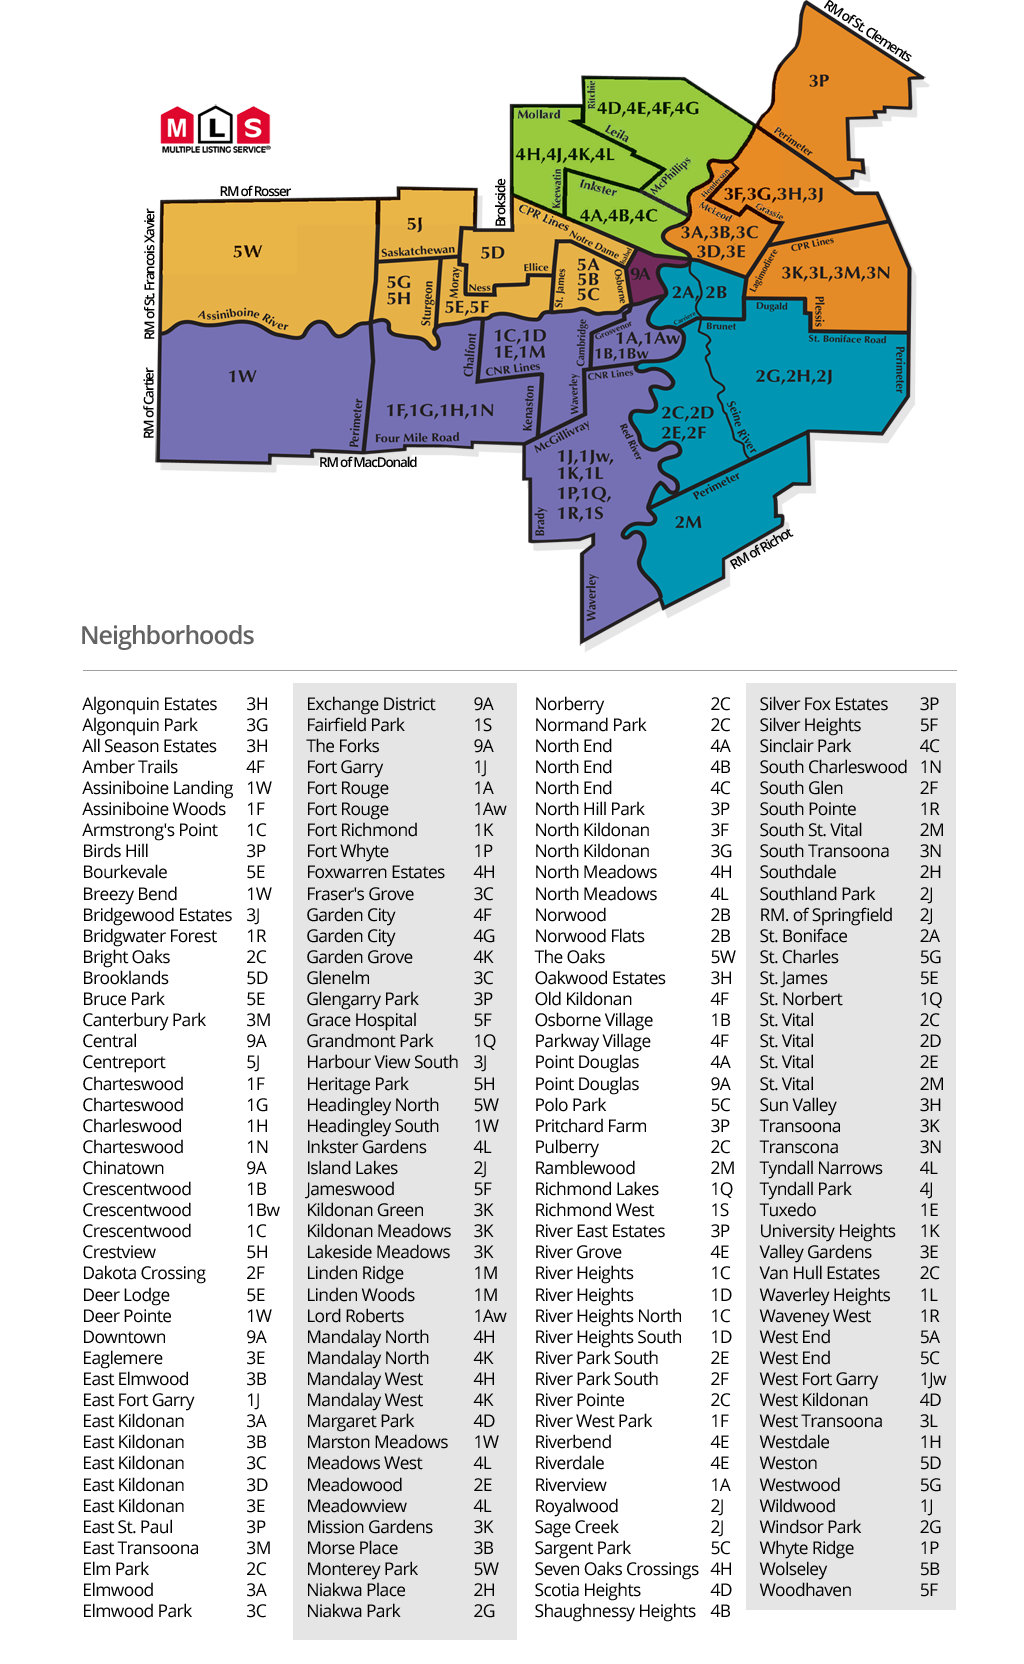
Guide on MLS area codes:
I’d classify absorption numbers as follows (From a YTD perspective):
85%+ = Extremely hot. Almost everything is selling on an offer day, not much is on the market.
70%-85% = Hot. most listings are selling, bidding wars happen, listings don’t sit long.
50-70% = Balanced. The best listings and best priced listings will sell without trouble, but greedy sellers and buyers may be in for disappointment.
35-50% = Cold. Most homes aren’t selling easily. There is likely a lot of supply on the market and most listings are stacking days on market with little attention.
< 35% = Extremely cold. The area is saturated with listings, very few properties sell quickly, very few buyers shopping in the area.
ANALYSIS
Here’s some of the hottest neighborhoods by absorption in 2024 (about 85% or higher):
1D - South River Heights - 90%
1G - Charleswood - 89%
1P - Whyteridge - 87%
2E - Meadowood - 87%
2F - River Park South - 86%
2H - Southdale - 86%
3B - East Elmwood - 87%
3C - Glenelm & Fraser’s Grove - 94%
3D - East Kildonan - 89%
3F - North Kildonan South - 86%
3G - North Kildonan North - 88%
3J - Harborview South - 87%
3L - Transcona West - 91%
4G - Garden City - 90%
4J - Tyndall Park West - 86%
5E - St James and Deer Lodge - 86%
5F - Silver Heights and Woodhaven - 91%
5G - Westwood - 96%
5H - Crestview - 90%
Another month of big numbers, and many of the same trends continuing!
The MLS areas starting with a 2,3 and 5 (South central, North East, and North West) have continued on their absolute rampage for yet another month, each featuring several areas above 90%+ absorption. For many of the particularly hot MLS areas above, there are less than 5 active listings available to purchase right now. Specifically, the “96% absorption all year long" area 5G - Westwood, has precisely 5 homes for sale in the entire neighborhood and area 3C- Fraser’s grove features only 4.
The really interesting footnote with this data is the number of MLS areas just barely missing the 85% cutoff to make the list. There were a total of 13 different MLS areas with between 80 and 84% absorption, which is a real testament to the strength and liquidity the vast majority of our market regions have available to them. When 32 out of 61 MLS areas throughout the city (with reasonable transaction volume) are clearing 80% absorption, it’s a good thing for the market overall.
Here’s a short list of neighborhoods I’m keeping a close eye on right now:
1E - Tuxedo (51% this month)
Around this time of year, I like to see what’s happening in Winnipeg’s most expensive MLS area as a litmus test for the rest of the market. As many of you know, prices are typically pushed up from the very bottom, and cut down from the top. If 1E is performing late into the year, I would consider this a canary in the coal mine for a very busy Spring 2025.
5G - Westwood(96% this month)
If you ever come to my office, odds are you’ll hear someone talking about the market in Westwood! It’s absolutely nuts, and it has been all year. It’s exciting to see a neighborhood have such an active market at this time of year. I love watching the outcomes of offer dates on products in this area, and I am feeling very optimistic for it’s future.
5C - Sargent Park and the West End (84% this month)
With the extremely large amount of business I do in 5C, I have to keep a very close eye on this area, and it’s performed wonderfully all Spring and Summer long. Absorption is high, prices are escalating yet still reasonable, and the buyer pool appears to be almost infinitely deep. I am watching closely to see if anything shifts, as despite the high level of activity, the area is know for very price sensitive buyers.
Takeaway:
Here are the key points from today’s market update:
The HPI index fell 0.47% month over month, to $419,600 and is down about 2.21% from the all-time high.
Supply metrics were very stable in July, showing strong year over year performance, while slipping slightly from the very good June 2024 numbers.
Absorption citywide remains very high, with 32 out of 61 active MLS areas featuring absorption over 80%
From a numbers standpoint, the Winnipeg market in July appears far stronger than July 2023 from nearly every available metric.
Stay tuned for the next article, leave a comment if you found this helpful, and feel free to reach out if you would like to discuss anything in further detail.