


Winnipeg Home Price Index Update - FEB 2025: Data From JANUARY 2025
Despite the cold and political chaos, Winnipeg Real Estate Surges in January 2025: What’s Driving Prices Higher?
JANUARY 2025 HPI Update
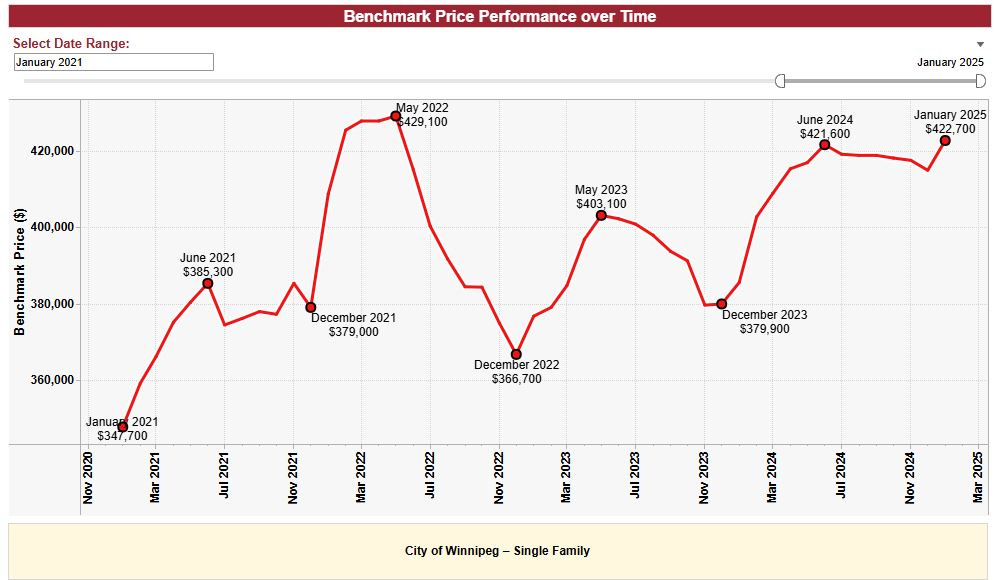
JANUARY 2025 Winnipeg Benchmark Price: $422,700 (down from $414,900 in December)
Year to date: +1.88%
Month over month: +1.88%
From 2024 High: +0.26%
From All-time High: -1.49%
The Winnipeg real estate market kicked off 2025 with a strong start, delivering the price gains that many market participants had been anticipating. The benchmark price surged by 1.88%—a significant jump that places us above Summer 2024’s peak and just 1.49% below the all-time high set in 2022. However, despite this headline-worthy price increase, the supporting data—average sale prices, absorption rates, new listings, and overall sales—show only modest month-over-month growth, largely in line with previous years.
Broader Context: More Than Just Market Forces at Play
Beyond local market conditions, January 2025 was shaped by three major external factors:
Really fricken exceptionally cold weather.
Significant and unexpected Bank of Canada policy changes.
Escalating U.S.-Canada trade tensions, including a proposed 25%+ tariff.
At the time of writing (Feb 3rd 2025, evening), the tariff implementation—originally scheduled for February 4—has been delayed by at least 30 days following a last-minute call between President Trump and Prime Minister Trudeau. The situation remains fluid, and its potential impact on the real estate market remains uncertain.
The Bank of Canada’s Role: QE, QT, and Market Stimulus
January’s real estate gains didn’t occur in a vacuum; they were at least partially influenced by the Bank of Canada’s recent moves. If the tariff threat materializes, we’re likely to see additional rate cuts and accelerated quantitative easing (QE) throughout the year.
To clarify some key terms (skip this if details bore you):
Quantitative Easing (QE) – The process by which central banks inject liquidity into the economy by purchasing government bonds and other financial assets, effectively lowering interest rates and making borrowing cheaper.
Quantitative Tightening (QT) – The opposite of QE, where the central bank reduces liquidity by selling assets or letting them mature, effectively tightening financial conditions.
Balance Sheet Normalization – A gradual approach to reducing the central bank’s asset holdings, often following periods of QE.
BMO economists are already projecting up to six additional rate cuts this year, which could bring the Bank of Canada’s policy rate down to approximately 2%. While this move is partly in response to potential tariff-driven economic weakness, it’s also a reaction to Canada’s high-priced real estate markets—many of which have struggled since the 2022 peak. With thousands of mortgages up for renewal in 2025 and 2026, policymakers appear to be prioritizing economic stability over inflation concerns.
Winnipeg’s Middle Market Remains Strong
Despite these national interventions, Winnipeg’s market remains fundamentally sound and does not require external stimulus. Demand remains strong in mid-tier price segments, where supply remains tight and homes continue to sell quickly. Given the interconnected nature of the market, this demand is likely to push prices upward across various areas, price points and property types.
Government Intervention and Inflation Concerns
The federal government has already pledged support for workers and businesses potentially affected by trade tariffs. While details remain scarce, any stimulus efforts will likely have inflationary consequences. The situation bears resemblance to the early stages of the COVID-19 pandemic—strong demand, unexpectedly lower interest rates, increased QE, and direct federal support. Back then, real estate prices took off very rapidly, and we could see a similar outcome here.
For more in-depth coverage, check out my 2025 Predictions article and Quarterly Performance Analysis on Substack.
Advice for Buyers and Sellers in Today’s Market
For Buyers:
If you’re struggling to find listings that match your criteria, stay patient—more inventory is coming. Consider working with a realtor who has access to off-market properties. Also, keep an eye on overpriced holdovers from 2024—writing an offer costs nothing and can sometimes lead to excellent deals.
For Sellers:
Many sellers I spoke with in January had similar perspectives:
“It’s too cold. No one wants to shop for houses right now.”
“I think rates will drop again in March, so I’ll wait for April.”
“I can’t give possession until June— I guess I have to list in March?”
If you’re planning to sell, your personal circumstances should dictate your timing more than the broader market. That said, listing earlier in the Spring market often results in stronger outcomes, as comparable sales data is more limited and buyers are willing to pay more in an upward-moving market. For those on the fence to whom time is of little consequence, there could be merit to listing sooner rather than later.
SUPPLY JANUARY 2025:
December Data:

January 2025:
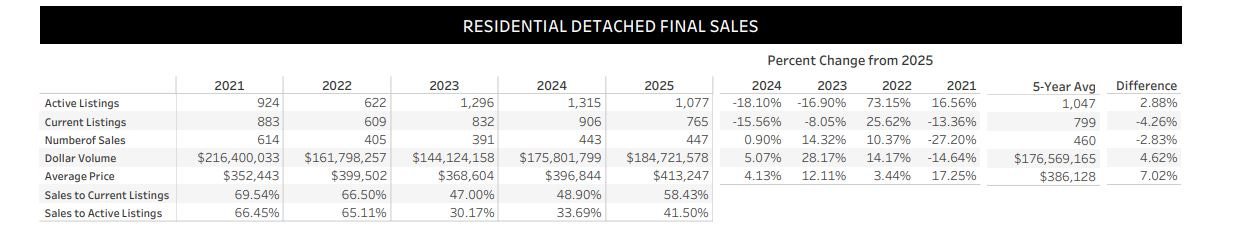
While the overall number of active listings appears higher than December’s, much of this increase is due to relistings of expired 2024 properties. The actual influx of new inventory remains moderate.
Interestingly, January saw fewer sales at a lower average price compared to December. Typically, January is stronger than December in terms of transaction volume. However, this year’s performance remains better than January 2023 and 2024, and only slightly behind 2021.
Despite the lower average sale price and the marginally lower transaction volume than last month, the benchmark price pushed approximately as high as I anticipated. In my eyes, the likelihood of a strong February dataset remains high.
Absorption Data:
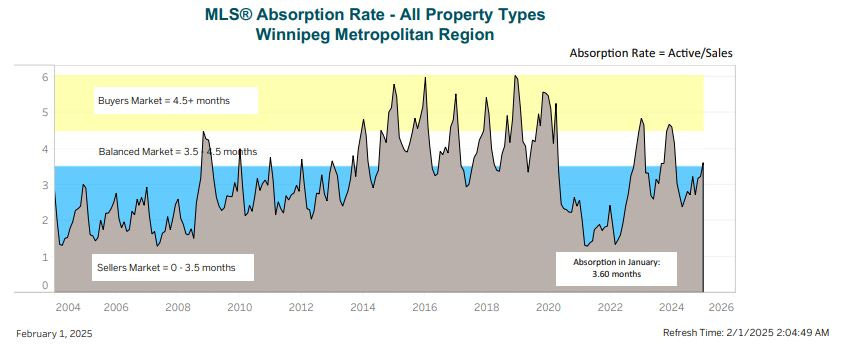
In a surprising turn of events, the citywide absorption chart rebounded toward balanced market territory — something seasonally normal, but not what I expected alongside the strong benchmark results.
With supply of detached homes remaining approximately stable month over month, the only conclusion I can draw from this modest move upward is some other property type (attached homes or condos), or calculation skew due to the vast relisting of expired property in January may be responsible. We’ll watch and see how this moves in February.
BIDDING WARS - OVER OR UNDER
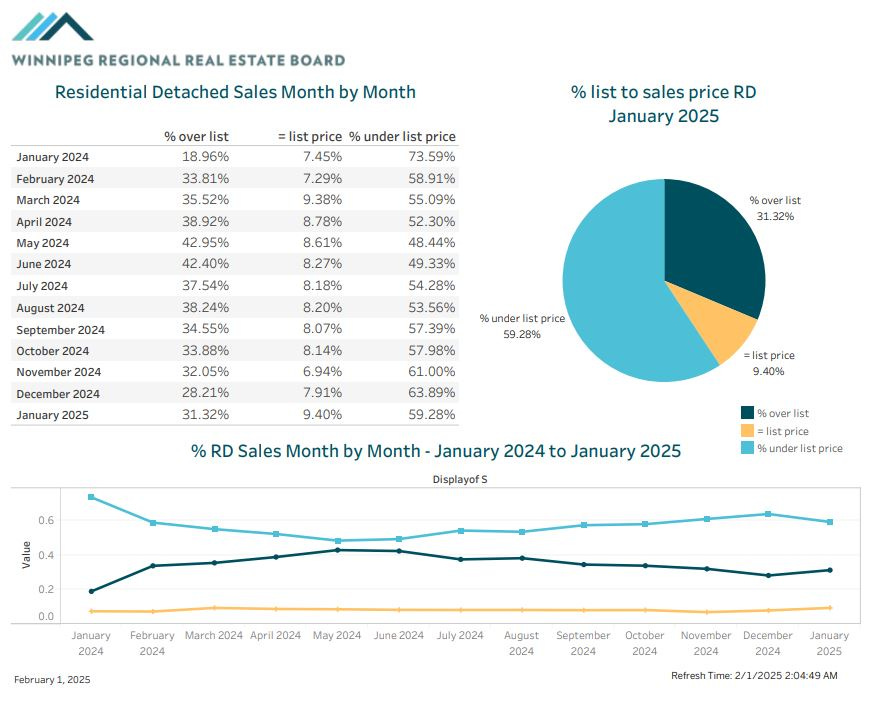
With 9.40% of detached homes selling at precisely asking price, buyers and realtors have a strong, mutual understanding of market value right now. This suggests that new data—particularly from January 2024 onward—is proving to be an accurate reference point for pricing.
When all market participants and their agents are aligned in value comprehension, realtors and sellers can freely begin to price listings in a more aggressive manner, as there is a high chance buyers and their agents will understand the listing and offer appropriately. As we’ve seen recently, pricing listings in this manner tends to generate high levels of attention, which often lead to multiple offer situations and sometimes, higher than expected sale prices. Expect this to ramp up in February, and continue strongly into the Spring market as we gain more context and data to work with.
In my own listings, pricing slightly above the target sale price has worked exceptionally well. While this doesn’t generate flashy “$100K Over Asking!” Instagram posts, it does lead to happy sellers achieving their goals with minimal hassle.
I’ll be covering pricing strategy by season in an upcoming YouTube video, so stay tuned!
Author’s Note: Pricing strategy is highly personal and situational. Before making any pricing decisions—whether buying or selling—reach out for a free consultation:
📞 204-955-0173
📧 keenanbrownrealtor@gmail.com
📱 @keenanb_ on Instagram
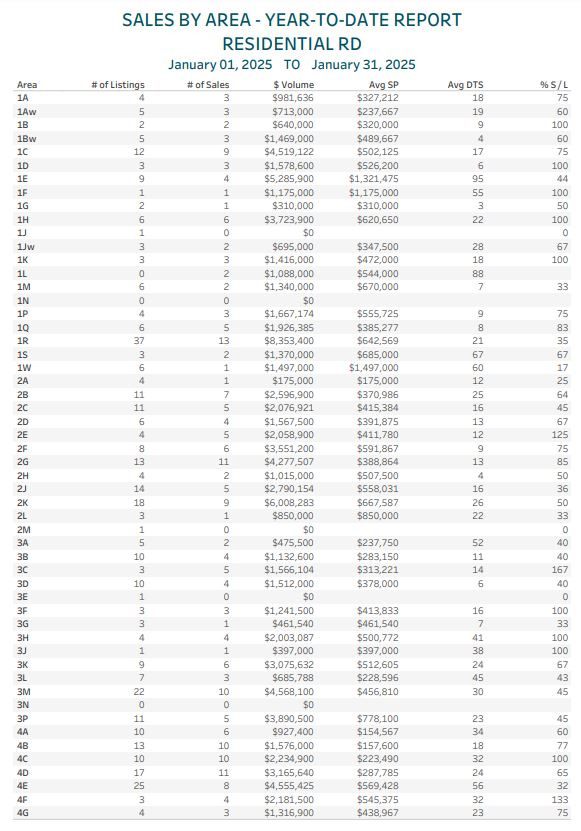
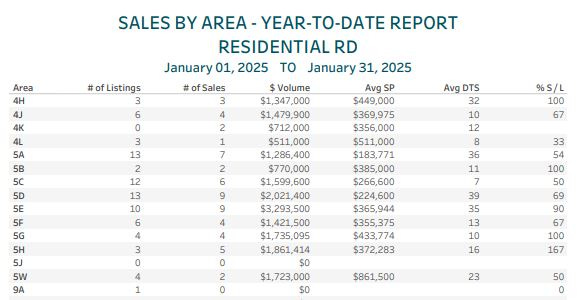
SALES BY AREA REPORT
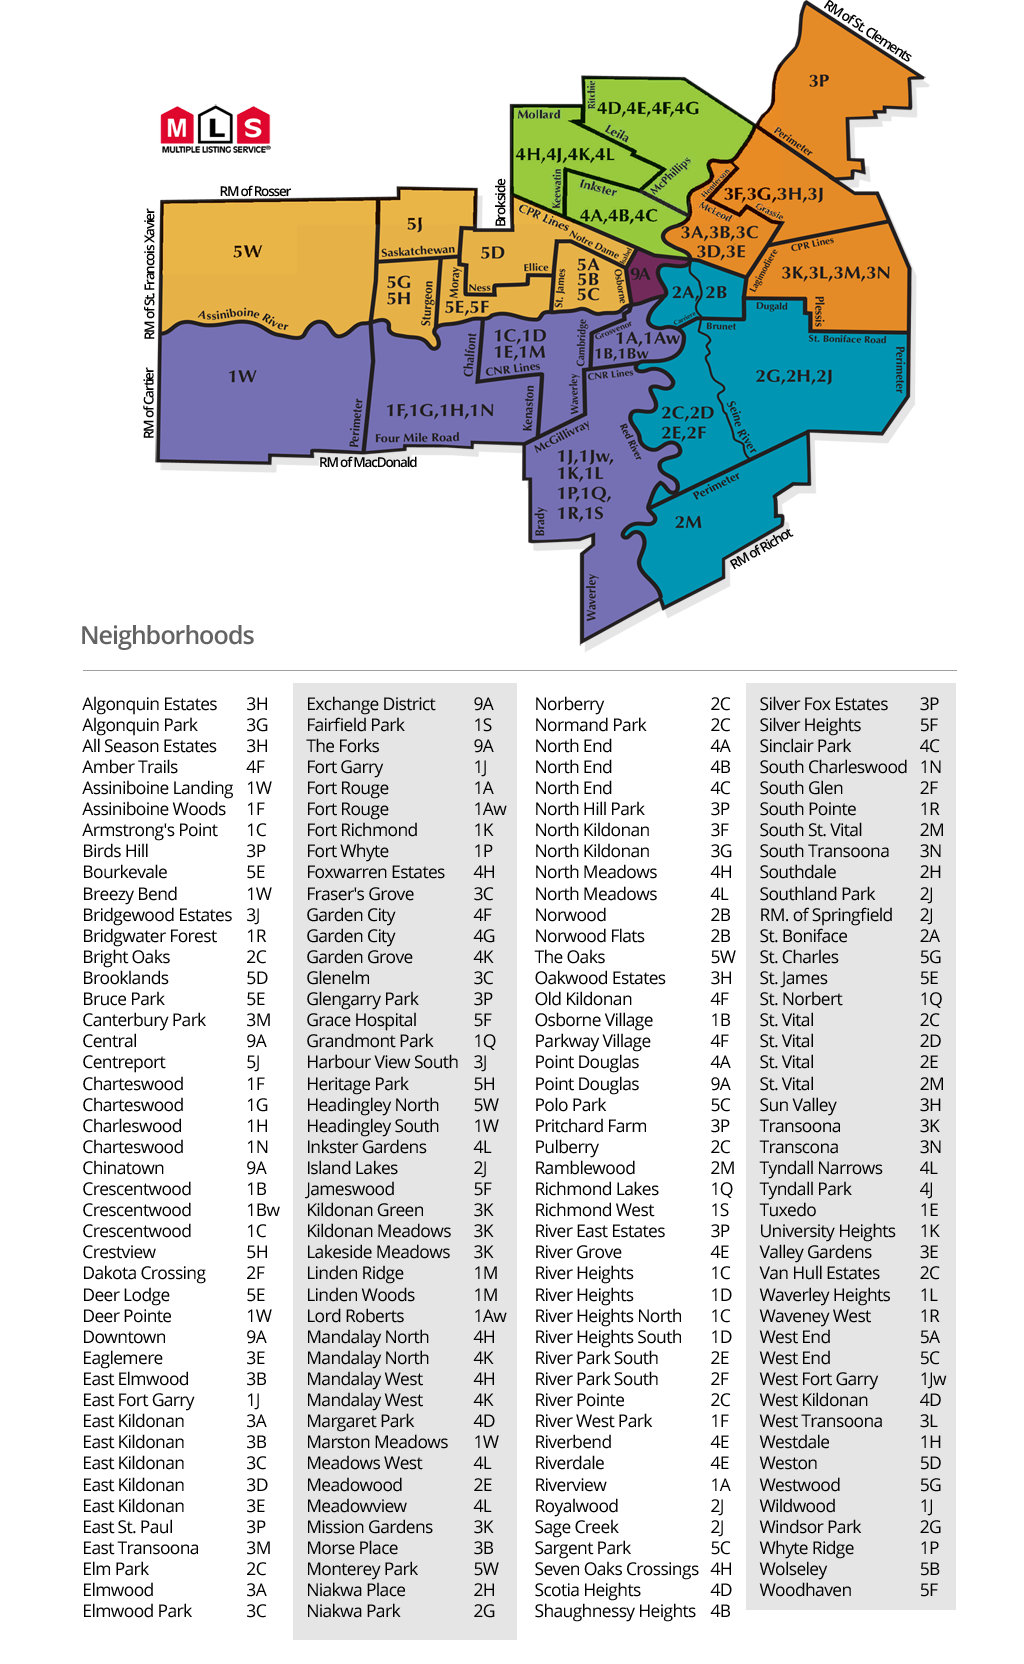
Guide on MLS area codes:
I’d classify absorption numbers as follows (From a YTD perspective):
85%+ = Extremely hot. Almost everything is selling on an offer day, not much is on the market.
70%-85% = Hot. most listings are selling, bidding wars happen, listings don’t sit long.
50-70% = Balanced. The best listings and best priced listings will sell without trouble, but greedy sellers and buyers may be in for disappointment.
35-50% = Cold. Most homes aren’t selling easily. There is likely a lot of supply on the market and most listings are stacking days on market with little attention.
< 35% = Extremely cold. The area is saturated with listings, very few properties sell quickly, very few buyers shopping in the area.
ANALYSIS
Here’s some of the hottest neighborhoods so far this year. Unlike most updates, many areas haven’t had much transaction volume yet this year. I will include only areas with at LEAST 5 SALES for January.
1H - Ridgewood West/Southboine - 100% (6 for 6)
2E - Meadowood - 125% (4 lists, 5 sales)
2G - Windsor Park - 85% (13 lists, 11 sales)
4C - St John’s/Sinclair Park - 100% (10 for 10)
5E - St James - 90% (10 for 9)
While most areas are just getting started for the year, the trends we saw going into the close of 2024 seem to remain intact for 2025. Several historically strong areas (e.g., the 3 starting areas) are missing from this list due to low listing volume rather than weak demand. As we move further into the year, I expect activity in these areas to increase.
Many MLS areas on the list have had fewer than 5 homes listed, but maintain 100% absorption. In the early stages of the year, it can be difficult to gauge how hot an area might be at any given time by looking at a dataset, but if you’re aiming to list immediately, a quick real-time analysis of active and pending listings can go a very long way.
Currently, there are at least 2 prominent MLS areas without an active listing, and a several MLS areas with fewer than 3 actives. This low listing activity and demand holding pace from last year is likely to yield a very interesting February review of this data, and a VERY interesting March Performance Analysis article.
Here’s a short list of neighborhoods I’m keeping a close eye on right now:
5F - Woodhaven/Silver Heights - (67% this month 6 lists 4 buys)
This area is usually incredibly hot, and it typically doesn’t take long for the absorption numbers to go crazy. The Woodhaven proper section of this area is still without a new listing yet this year, and I am beginning to think I may (or may not) be the first to buck that trend later this month. With supply at normal levels for this time of year, I have been curious to see what might happen to this area once the frenzy kicks off.
4A - The North End - 60% (10 and 6 this month)
Until recently, I hadn’t spent a ton of time thinking or writing about 4A, but through a series of circumstances, I spent an above average amount of my time looking into the numbers and dynamics of one of Winnipeg’s toughest MLS areas. With 2025 numbers looking better than normal so far, I think the value proposition of some of 4A’s better parts might begin to look attractive to budget conscious homebuyers or investors seeking high yield low leverage properties. I’ll be keeping an eye on the dynamics here as I watch the rest of the market move upwards in a big way.
5C - Sargent Park and the West End (50% , 12 and 6 this month)
As I typically do higher than average volume in 5C, I watch almost everything that goes on in here. This month, some of the best houses so substantially over asking, while other less desirable properties sat. 5C is quickly rebounding from the 2022/2023 lows and will likely remain a solid option for first timers looking for a safe area at a reasonable price in 2025.
Takeaway:
Here are the key points from today’s market update:
The Benchmark Price rose 1.88% month over month to $422,700 from $414,900 and remains down about 1.49% from the all-time high.
Interest rate policy & political developments could create a frenzied Spring market.
Absorption remains strong, especially compared to January 2023/2024.
January 2025 saw the strongest price gains for any January since 2022.
For deeper insights, read my Performance Analysis and 2025 Predictions articles.
Need advice? Let’s chat!
📞 204-955-0173
📧 keenanbrownrealtor@gmail.com
📱 @keenanb_ on Instagram
A podcast version of this update will be available during the week following Sunday Feb 9th, which will feature a very special guest, Sarah Dobie with the Re/Max One Group. We’re excited to chat with Sarah about her journey into, out of, and back into the real estate sector, mindset, respecting the grind, and more.
As always, if you find these updates helpful, please subscribe (it’s 100% free and always will be!)