


Winnipeg Home Price Index Update - DEC 2024: Data From NOVEMBER 2024
With pricing continuing to hold steady near the yearly high, the Winnipeg real estate market is looking more and more like a powder keg set to go off in Spring 2025
A podcast version of this update will be available during the week following Sunday Dec 8th, which will be centered around goal setting for 2025, year-long market trends, expectations going forward, and more! Also, stay tuned for the quarterly data analysis article coming Dec 16th. In this series, I break down all of the data by each MLS area instead of focusing entirely on citywide data - not to be missed if you’re looking at investing this year! As always, if you find these updates helpful, please subscribe (it’s 100% free and always will be!)
NOVEMBER 2024 HPI Update
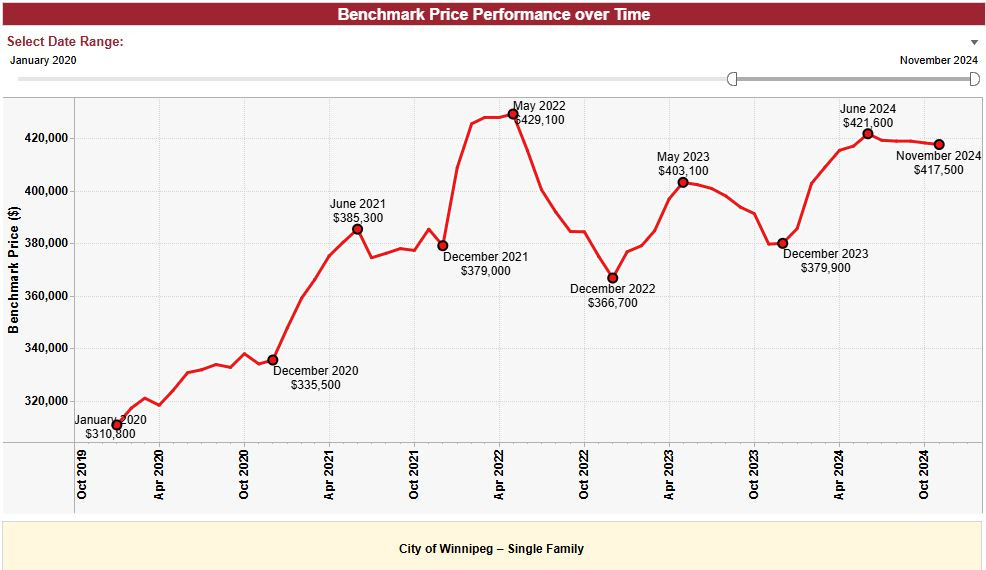
NOVEMBER Winnipeg Benchmark Price: $417,500 (down from $418,100 in October)
Year to date: +9.90% (Was +10.06% last month)
Month over month: -0.14%
From 2024 High: -0.97%
From All-time High: -2.70%
Another month in the books, and November 2024 proved to be anything but ordinary for Winnipeg real estate. At first glance, the month may appear steady and unassuming, but the data tells a much more compelling story, especially when considered in the broader context of housing trends and economic shifts across Canada and beyond.
Traditionally, November is among the quietest months for real estate activity, but I found this year’s numbers very difficult to ignore. Despite the usual seasonality we face in Winnipeg, our market displayed a surprising amount of resilience and strength at this late point in the season, hinting at big things for 2025 and probably, beyond.
Before moving on, I’d like to remind all of you of the sentiment we saw last November - particularly when the market declined by over 3% in a single month. Most market participants were wrought with feelings of fear, uncertainty and doubt. Sentiment heading into 2025 couldn’t be more distinct from last year. While winter months traditionally have featured price pullbacks, this year’s momentum suggests that the Winnipeg market is well-positioned to defy the seasonal lull and load up a proverbial powder keg with a fuse set to go off some time in Spring next year.
Winnipeg's housing market saw significant cuts in overall active supply this month, even as a seasonally normal number of new listings hit MLS. While the benchmark price saw a slight decline, the average sale price continues to accelerate, now sitting well above both the current benchmark price and the benchmark’s all-time high. This discrepancy highlights the persistence and strength of the non-price data we’ve been experiencing all year, notably the fact that absorption rates remain at seller-favored levels - even as we head into late-season months. Additionally, bidding wars are still common, as buyers and sellers seem to be on the same page on value, and “offers as-received” is not necessary or appropriate when you’re selling into a 90%+ absorption market.
As for the macro perspective, November 2024 was possibly the most eventful single month of the year in all of 2024. Many of the main events are very significant in terms of their implication on real estate, and I am unfortunately going to need to break out the bullet points in my introduction:
The Bank of Canada’s interest rate cuts and further guidance for cuts into December and beyond, promise increased affordability for borrowing. This is already transpiring, with fixed rates around 4% are beginning to be offered, with even lower offerings likely on the horizon.
A historic U.S. presidential election win by Donald Trump, accompanied by tariff threats, and ongoing financial discourse that could impact global markets, notably relating to currency exchange rates and the strength of the Canadian dollar.
A remarkable stock and crypto market rally, pouring more wealth into the hands of investors, which often trickles into real estate at the end of the day.
Rumors of a GTA condo and assignment market collapse, which if true, could prompt action to prop up markets nationally, inadvertently boosting Winnipeg - which I’ve consistently argued doesn’t necessarily need stimulus.
And, of course, the unforgettable video from Prime Minister Trudeau, apologizing for immigration-related issues and outlining a pivot in policy in what can only be described as a tone-deaf "cringe YouTuber apology video" style that left many questioning the government’s housing policies, as well as their competence.
For Winnipeg, these events are largely, but not necessarily entirely positive. As a well-insulated and still-affordable market, Winnipeg stands to benefit while larger metro areas face turbulence. The ongoing trend of financialization of housing, where homes increasingly function as financial instruments first and living spaces second, is now reaching Winnipeg later than many other Canadian cities. As I’ve written and spoken about extensively for years now, this delay positions Winnipeg for an outsized rally as affordability dwindles in Canada’s larger markets and policies designed to stabilize the unaffordable cities like Toronto and Vancouver inadvertently pump up smaller markets like ours.
Even in the face of typical seasonal headwinds, November 2024 has proven to be one of Winnipeg’s strongest late-season markets in recent memory. The combination of seller-favored conditions, strong demand, and external economic shifts has set the stage for a very significant rally heading into 2025. If you’re considering buying, selling, or investing in Winnipeg real estate in 2025, now is the time to act. The November data shows a market that’s firing on all cylinders, and the momentum is only expected to build as we move into the new year.
Whether you’re a first-time buyer, an investor on the hunt for deals, a homeowner considering your next steps, or a landlord looking to take some chips off of the table, this is the perfect time to start planning. Feel free to reach out to me—let’s have a conversation about your goals, and I’ll work with you to create a strategy that fits your timeline. Let’s get you ahead of the game and make a plan for an amazing 2025!
SUPPLY November 2024:
October Data:
November Data:
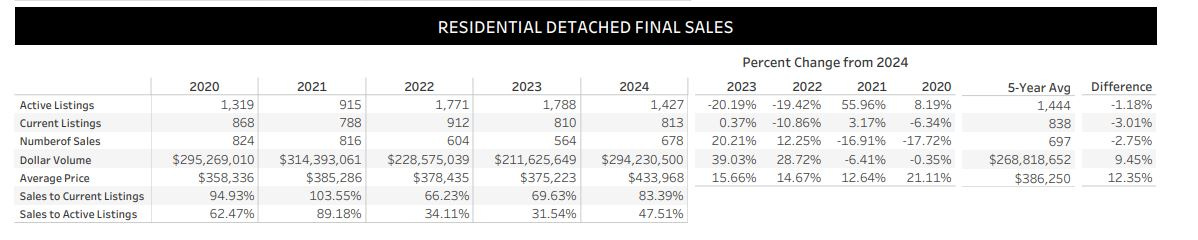
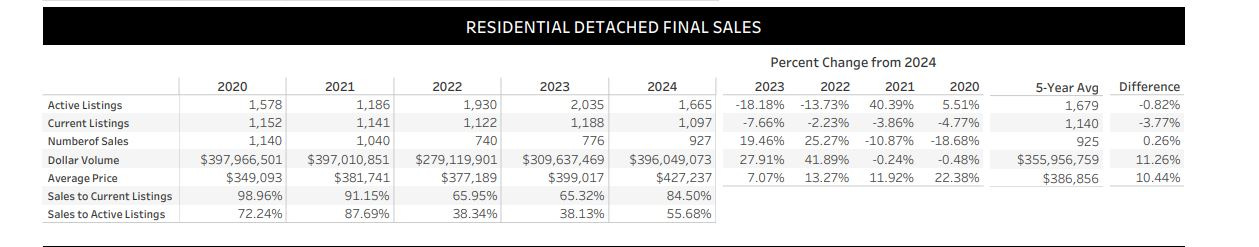
As supply continues to trend downwards, the number of transactions is following at a relatively commensurate level. A total of 679 transactions occurred for detached homes in November 2024, which is 10-20% more than either 2023 or 2022, but roughly 16-17% less than 2020 and 2021 - the busy years from the pandemic. This is essentially in line with the trend from October, illustrating the persistent strength our market is showing in this late season.
Watching the average sale price jump to $433,968.00, which is now higher than the benchmark price all-time high, I have to say, I am impressed. If we hypothetically enter the new year with the average sale of a detached home already above the benchmark price, the early season gains could prove to be extraordinary. With supply overall sitting 15-20% lower than last month, and lower than we’ve seen in 2022 or 2023, the stage appears clearly set for big things at the turn of the calendar.
Absorption Data:
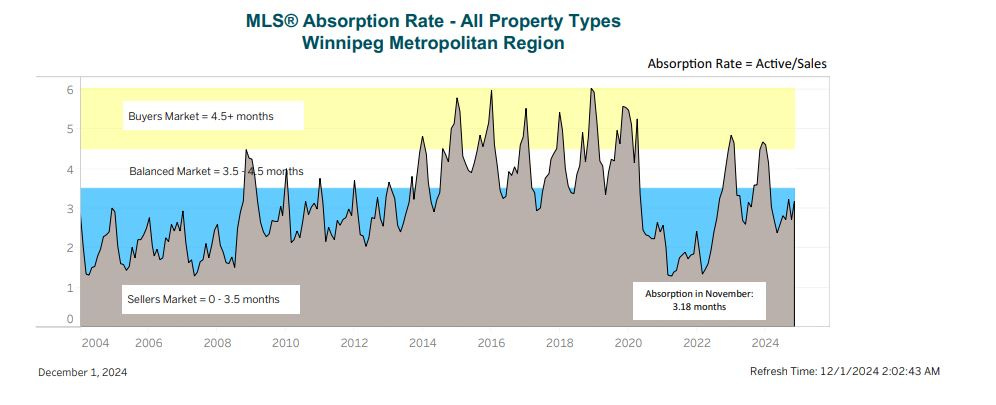
Absorption citywide returned to the seasonally typical trend of spiking back towards the buyer favored chart area, however it is entirely possible we could finish the year without returning to even a balanced market. When considering the active supply overall, and the rate at which new homes are being brought to market, it’s unclear that there is enough active listings remaining at this late stage to make significant absorption changes possible on the chart at all. Expect the 2024 spike to look more akin to the 2010-2013 era than the 2022 and 2023 data points.
BIDDING WARS - OVER OR UNDER
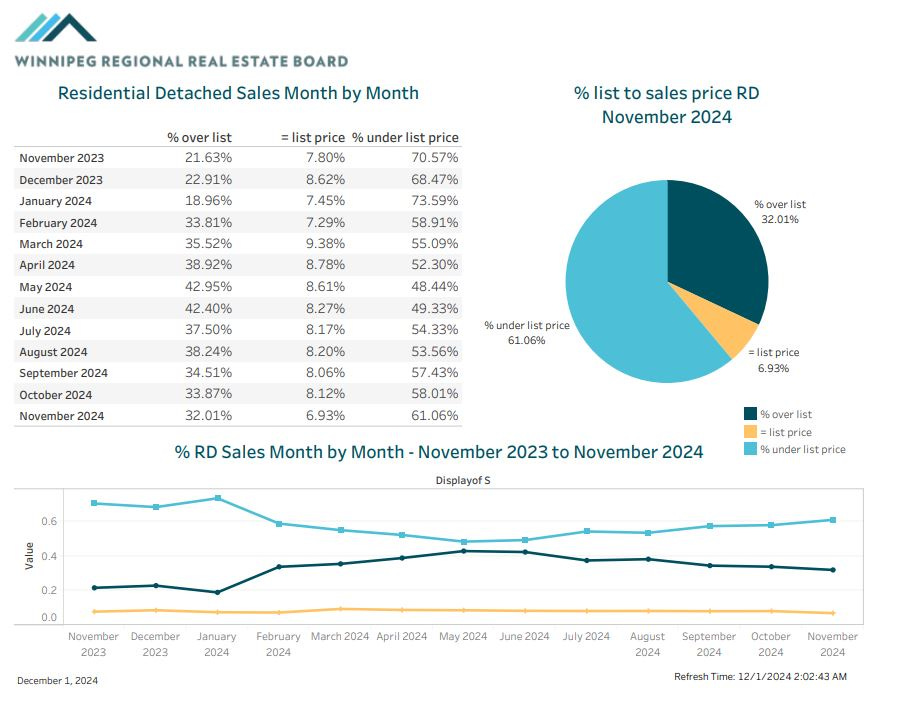
As far as listing strategy goes, slightly fewer homes sold at or above asking price in November, 39% vs 42% to be explicit. Once again, this is one of the highest rates we’ve seen at this time of year since 2021. As I’ll outline in detail shortly, the supply citywide remains relatively low, but certain MLS areas have been squeezed for product for essentially the entire year. Shopping in these super high absorption neighborhoods feels more like an early Spring market than I’ve seen in a long time. While there are certainly areas slowing down (and bringing the averages down with it), many of Winnipeg’s most desirable areas concentrated approximately around an average price point are seeing spectacular activity, and creating listing trends which are cascading citywide. It’s not every day you see November listings selling effectively with Spring strategies.
Authors note: the decision to execute a marketing strategy designed to yield multiple offers is a highly personal and situationally dependent decision. Before making ANY decisions regarding the pricing of property you own, or establishing an offer price for a property you wish to own, I would highly suggest you reach out to me over phone, email or DM for a free consultation on your specific circumstances. If you don’t like me personally, I have a wonderful network of skilled agents who would be more than happy to assist you in any way they can. Please do NOT take what is written here as personal advice for your specific property/situation without consulting me directly. keenan@judylindsay.com // 204-955-0173 // @keenanb_ on Instagram
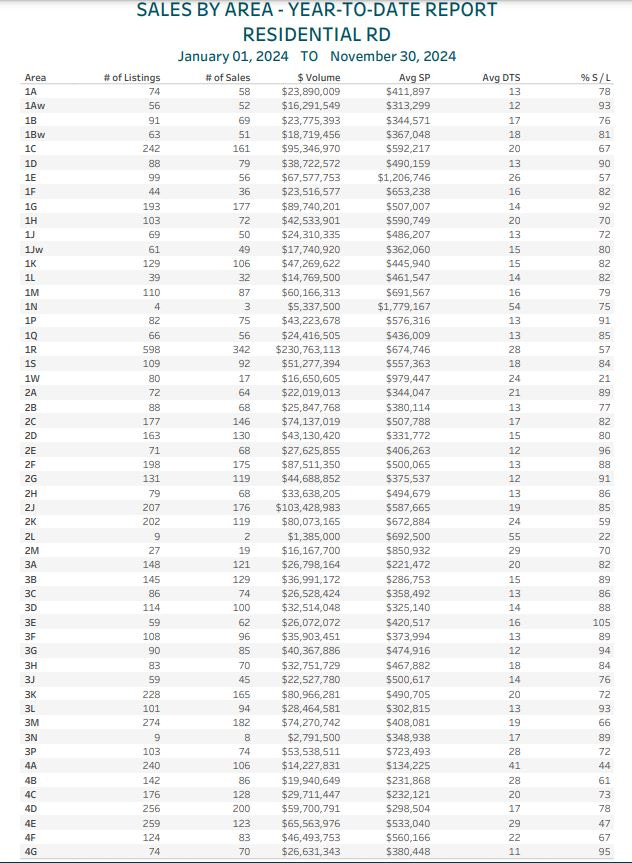
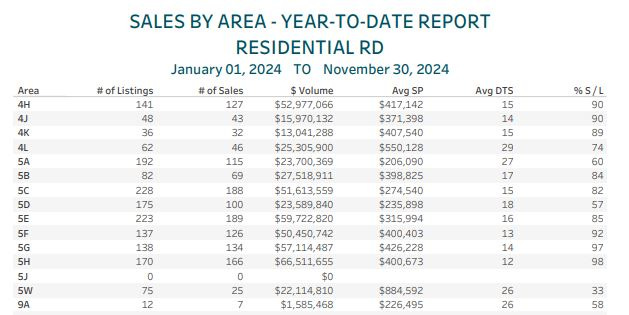
SALES BY AREA REPORT
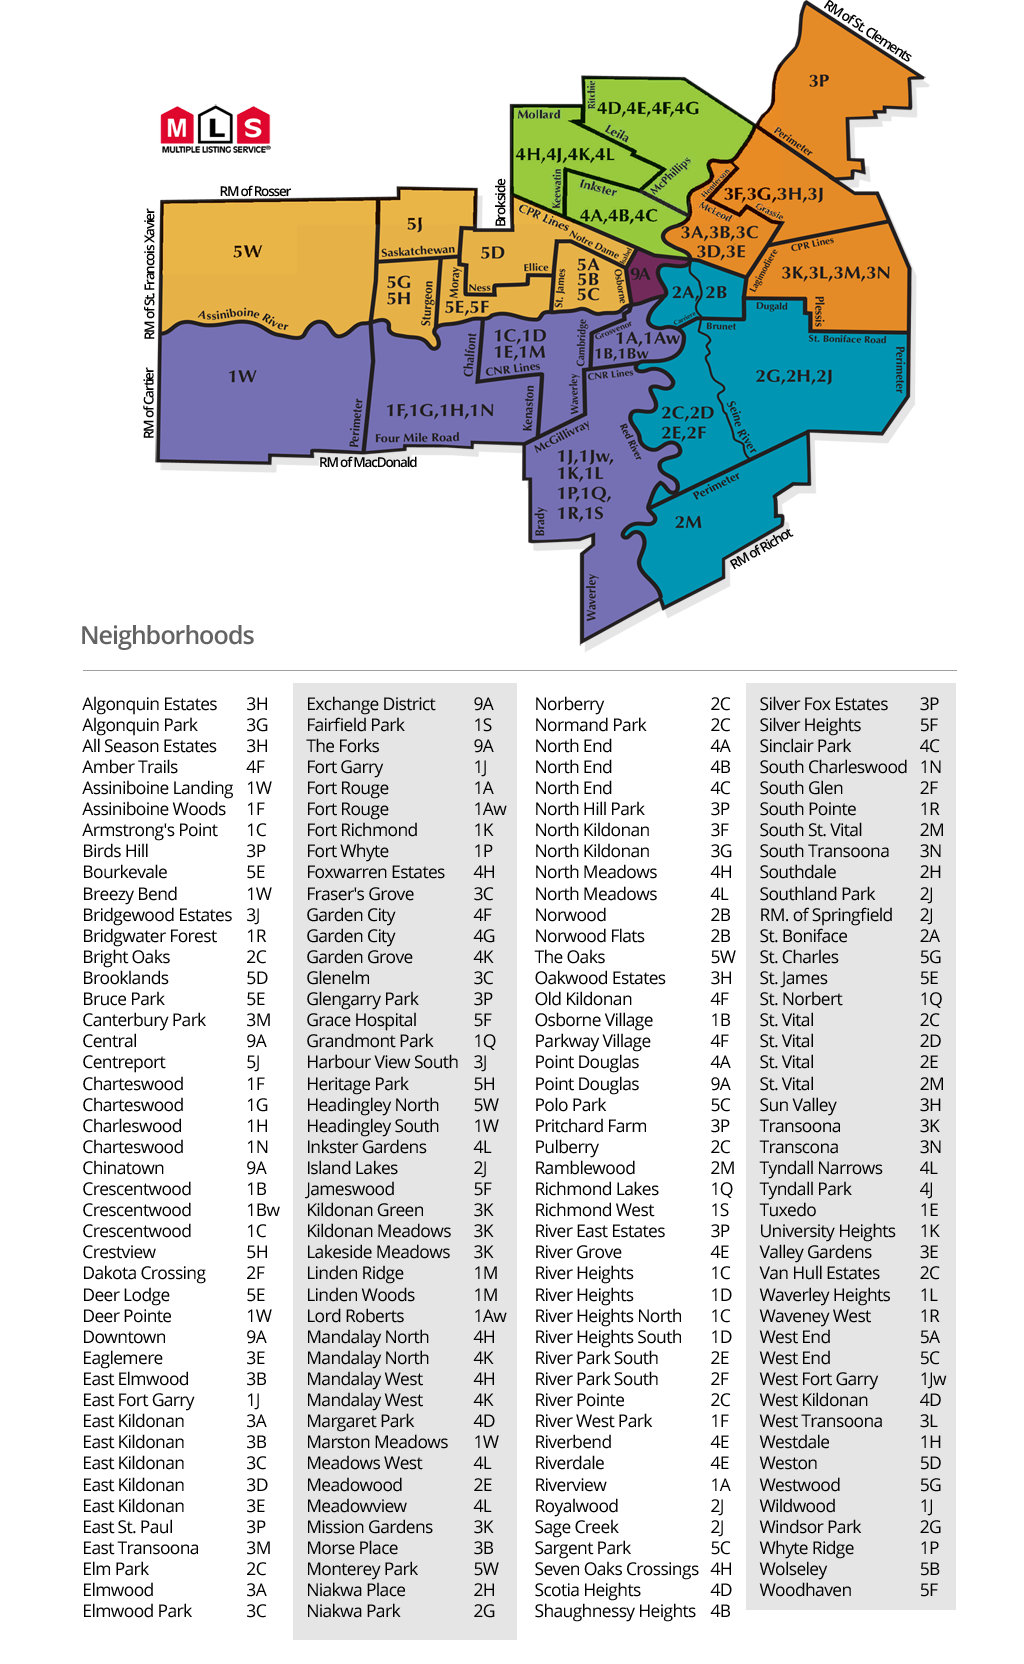
Guide on MLS area codes:
I’d classify absorption numbers as follows (From a YTD perspective):
85%+ = Extremely hot. Almost everything is selling on an offer day, not much is on the market.
70%-85% = Hot. most listings are selling, bidding wars happen, listings don’t sit long.
50-70% = Balanced. The best listings and best priced listings will sell without trouble, but greedy sellers and buyers may be in for disappointment.
35-50% = Cold. Most homes aren’t selling easily. There is likely a lot of supply on the market and most listings are stacking days on market with little attention.
< 35% = Extremely cold. The area is saturated with listings, very few properties sell quickly, very few buyers shopping in the area.
ANALYSIS
Here’s some of the hottest neighborhoods by absorption in 2024 (about 85% or higher):
1Aw - Lord Roberts - 93%
1D - South River Heights - 90%
1G - Charleswood - 92%
1P - Whyteridge - 91%
1Q - St Norbert - 85%
2A - St Boniface - 89%
2E - Meadowood - 96%
2F - River Park South - 88%
2G - Windsor Park - 91%
2H- Southdale -86%
2J - Island Lakes - 85%
3B - Elmwood East Kildonan - 89%
3C - Glenelm/Fraser’s Grove - 86%
3D - Mid Kildonan - 88%
3E - Valley Gardens - 105%
3F - North Kildonan south - 89%
3G - North Kildonan North - 94%
3L - Transcona West - 93%
4G - Garden City - 95%
4H - The Maples - 90%
4J - Tyndall Park East - 90%
4K - Tyndall Park West - 89%
5E - St James - 85%
5F - Silver Heights + - 92%
5G - Westwood - 97%
5H - Crestview & Heritage Park - 98%
We are now up to 26/66 active Winnipeg MLS areas making the hot list! The areas which are hot, are REALLY hot - no surprises here to any long time readers. The real news is the strength of the areas which didn’t make the list.
Almost every area citywide with exceptions being only the most and least expensive areas are sitting between 70 and 100% absorption. That means for anyone buying a relatively normal home - no luxury mansions and no questionably located rentals, the base case scenario is 7/10 houses listed are selling within the month they hit the market, and in most areas, that is actually closer to 9/10.
This adds a really interesting twist to both seller and buyer strategies late season. Typically, the late season is defined by buyers having more power on price, but greatly reduced selection. This year, buyers are being greeted with greatly reduced selection, increased competition, and pricing at least as high as virtually any other time this year.
As a seller, it’s clear buyer activity is higher than normal for this point in the year, but it is still risky to execute a Spring-style listing strategy in a slightly slower time. Anecdotally speaking, most of the listings I’ve seen sell recently were priced agreeably, but relatively close to what they ended up selling for. This conservative approach generally makes sense for the time of year, but it opens the door for very aggressive sellers to create utter mayhem with extremely attractive listings in the early 2025 season.
As a buyer, the situation is unlikely to improve for you any time soon. Pushing a little bit to get into a home you love today is likely to look very wise in as little as 6 months. The obvious issue is finding the home you actually like in the face of a low supply market, and then managing to win the bidding war if it actually comes up. Stay patient, stay vigilant for all of December, and be prepared to act with speed in 2025
Here’s a short list of neighborhoods I’m keeping a close eye on right now:
1G - Charleswood - (92% this month)
Charleswood is an area I spend a lot of time working in, both on the listing and the buying side. This entire year has been hugely busy, but the demand for the most conventional products in the area has shown to be insatiable. I am always watching for sale prices and new active listings throughout the area, and I am keeping my eyes peeled for well priced entry level products for the foreseeable future. Note: If you’re a Realtor reading this, and you have a decent bungalow coming up in Charleswood, send me a message, let’s chat!
1R - Bridgwater & extended neighborhoods (57% this month)
1R is still seeing a high degree of listing activity, but most of it appears to be new builds. A lot of older construction is continuing to sell, but the sheer size of the area makes any slight progress hard to note compared to MLS areas with smaller volume. I think 1R is among a handful of areas that stands to gain the most in 2025, and many disillusioned buyers who are likely to be put off by bidding wars may have had their budgets unexpectedly increased via rate cuts, and may find themselves turning to a lower absorption area with a lot of solid options, and pricing which can be analogous to the neighboring areas.
5C - Sargent Park and the West End (82% this month)
I will likely have eyes on 5C for the rest of my life, but the activity here has been really strong! 5C is proving it remains a highly desirable entry level area suitable for first timers homeowners, investors and downsizers alike! With increasing absorption, strong price action, and persistent demand, I have very high hopes for this area in 2025.
Takeaway:
Here are the key points from today’s market update:
The HPI index fell slightly month over month to $417,500 from $418,100 and remains down about 2.70% from the all-time high.
Supply metrics and sale volume remain very strong, particularly when considering seasonality.
Average sale price exceeded $433k, which surpasses the all-time high for the benchmark rate, hinting strongly at a very hot start to the 2025 market.
Absorption citywide remains incredibly high and is increasing at an unseasonably irregular rate. Many areas are still experiencing virtually no supply and consistent bidding wars on anything coming to market.
The stage is set for a very strong 2025, and most all of the signals are pointing to higher prices in the future. Take action today, and make a plan for the busy upcoming year now!
Stay tuned for the next article, leave a comment if you found this helpful, and feel free to reach out if you would like to discuss anything in further detail.