


Winnipeg Home Price Index Update - NOV 2024: Data From OCTOBER 2024
With pricing holding steady, the Winnipeg market is showing incredible strength in the late stages of the year. Is it too early to know if we are in for a repeat of Winter 2021?
A podcast version of this update will be available during the week following Sunday Nov 3rd, which will feature our friend and expert from the financial services industry, Rashawn Browne with IG Wealth Management! As always, if you find these updates helpful, please subscribe (it’s 100% free and always will be!)
OCTOBER 2024 HPI Update
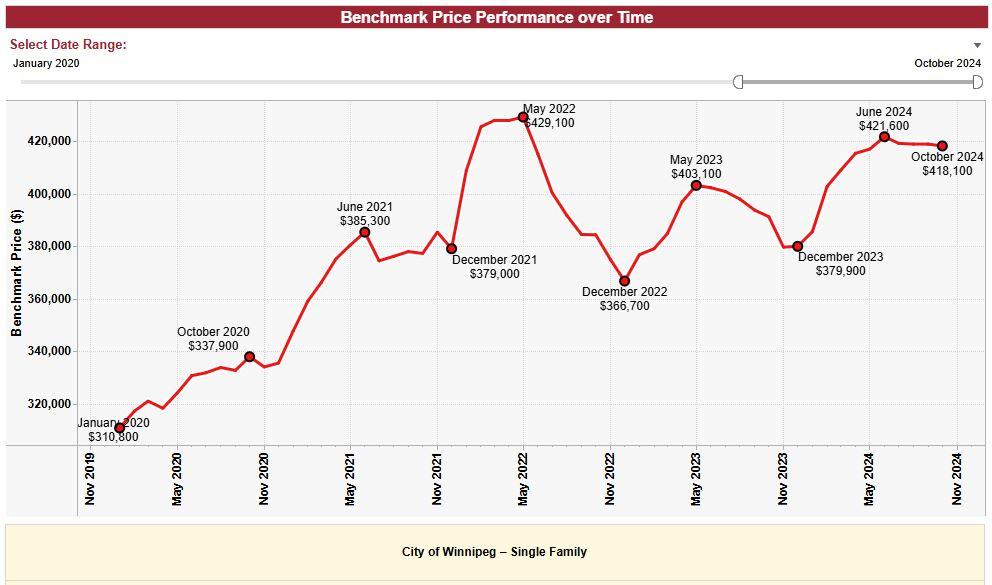
OCTOBER Winnipeg Benchmark Price: $418,100 (down from $418,800 in September)
Year to date: +10.06% (Was +10.24% last month)
Month over month: -0.17%
From 2024 High: -0.83%
From All-time High: -2.56%
The market remains hot! Truly uncommon for the season, our real estate market is looking unbelievably strong in terms of supply, pricing, absorption and buyer behavior. With many homes continuing to successfully sell with offer date strategies, and very few homes sitting on the market for longer than a week or two, this October felt a lot more like a late summer month rather than the start of the 4th quarter.
All of the same factors impacting our market last month have continued to play a major role this month - weather, interest rates, macroeconomics, buyer sentiment, and politics. While I do not think any single factor is driving our market entirely on its own, the combination of these factors has resulted in one of the strongest Octobers we’ve seen since 2021, and possibly one of the strongest we’ve had in the last 15 years.
When considering the data, almost every possible metric is moving in a more robust, seller-favored direction than last month, with the rare exceptions remaining neutral. This is abnormal behavior for the season, and it will likely have large impacts on the trajectory of the benchmark price as we head into November and December - our two traditionally slowest months.
As a potential buyer looking to shop right now, you may find yourself dealing with a market more reminiscent of late summer. Bidding wars are still very common, supply remains relatively low, and the best listings are not lasting long. With the frenzy continuing, it is important to stay focused and try to not get discouraged. Such strong market activity late in the year typically precedes an outrageously hot Spring market, which might price certain buyers out of certain areas/products. If you’re a value-minded buyer, I’d be looking to scoop up a property or two before the year’s end.
As a potential seller, if possible, wait until next year. If that’s not possible, you have a really good chance of getting a great outcome this November given the strong activity, but don’t be upset if we see another big run-up in the first 3 months of 2025. Obviously, selling out of necessity is a common factor in the late-season real estate market and it is absolutely possible to execute a very successful campaign in November and December, especially with a market as active as this one.
SUPPLY October 2024:
September Data:
October Data:
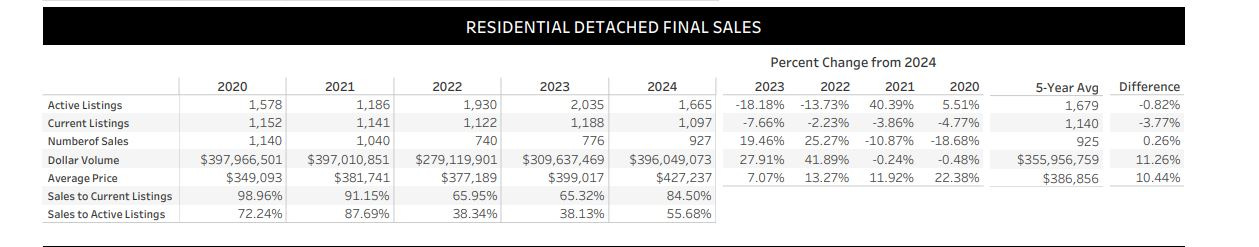
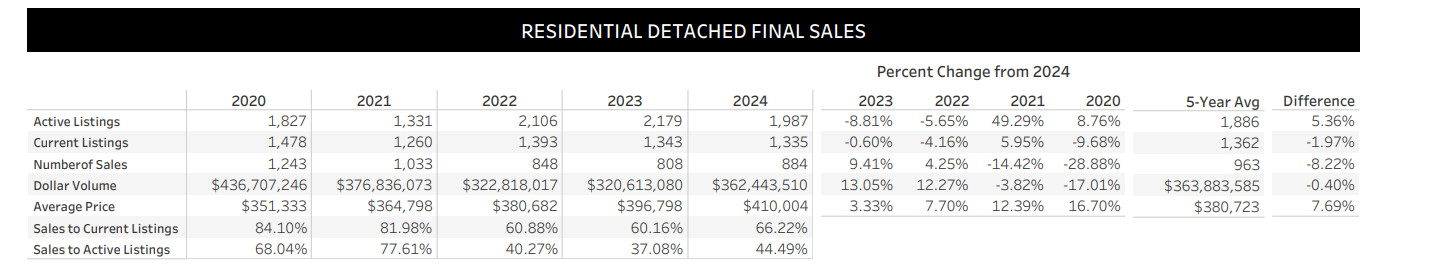
Very strong supply data for October! Both active and current listings are down significantly from both 2022 and 2023, while current listings are at the lowest level seen in the last 5 years, including the very hot 2020 and 2021 Fall season. Additionally, the number of transactions overall was nearly 20% higher than October 2023, and nearly 25% higher than October 2022, which is a staggering jump.
Month over month, October had fewer listings overall than September, which is typical, but despite the lower supply, October also featured 10% more sales as well as a significantly higher average sale price. This activity left October 2024 with one of the best sales to current listings ratios we’ve seen since the pandemic era at 84.5% for the month.
With the average sale price jumping back to $427,237.00, I can’t help but feel it is likely our “Winter taper” might be one of the smallest we’ve seen in a while. The strength and momentum the market has shown from this data alongside the very limited supply of quality product is likely to yield a higher-than-usual amount of activity in the final 8 weeks of the year. Our baseline price heading into 2025 may end up starting us off much higher than we expected.
Absorption Data:
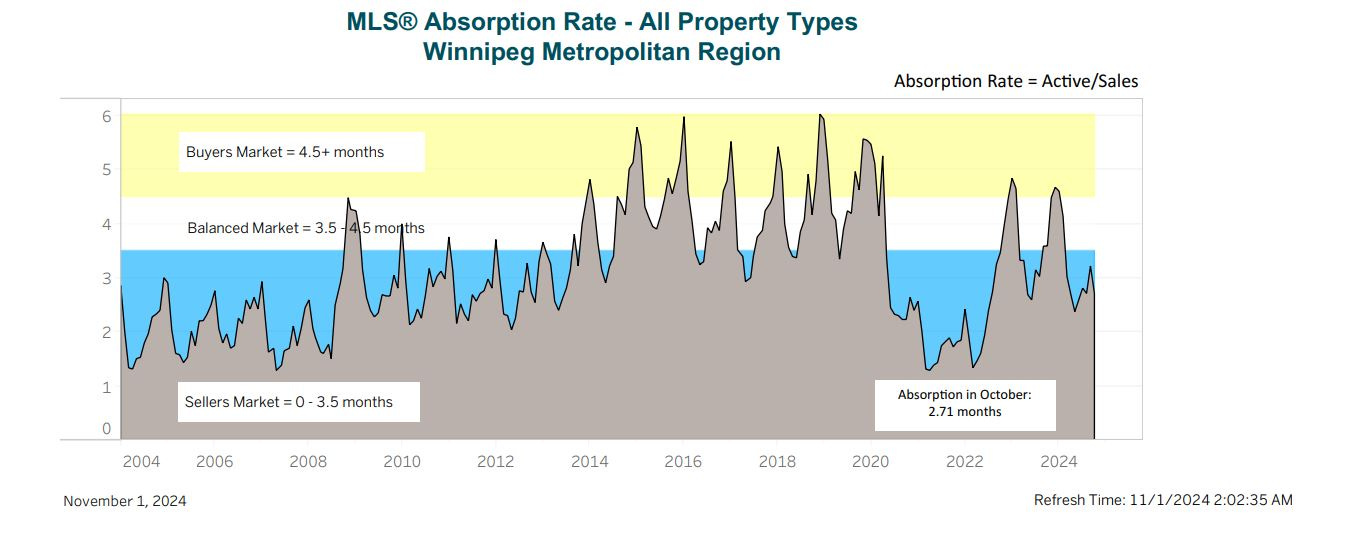
October absorption broke sharply from the seasonal trend of gradually drifting towards balanced/buyer favored by leaping us back to an absorption level similar to July or August. This jump is certainly not normal for the time of year, and is another critical data point I’m considering when making predictions and planning my year for the early stages of 2025. At the rate the trendline appears to move, it is quite likely our market may not enter buyer favored territory at all this year, and may only briefly dip towards balanced market territory.
BIDDING WARS - OVER OR UNDER
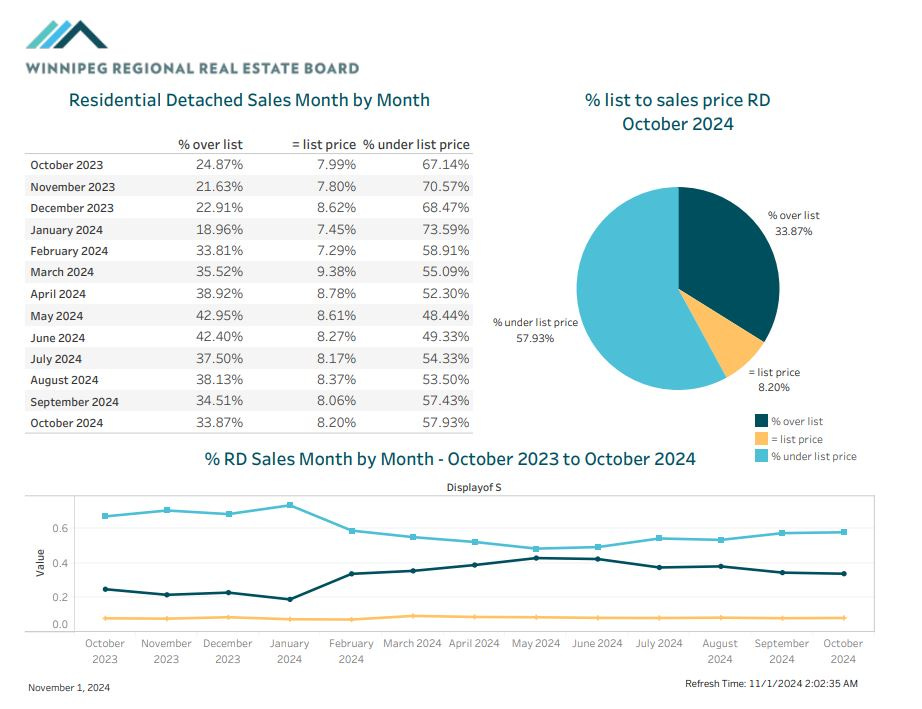
The Bidding war trend remained virtually identical to where we left off with the September data, with approximately 42% of listing selling at or above asking price - a level similar to February or March of this year. Anecdotally, this makes a lot of sense, as many agents and sellers recognize the high level of showing activity across the vast majority of price points remains likely to yield several interested purchasers, which means taking offers as received could potentially leave money on the table. As long as supply continues trending lower, it may end up being viable to list property with offer dates all the way through November this year. As a buyer, be prepared to compete, even when the snow starts falling.
Authors note: the decision to execute a marketing strategy designed to yield multiple offers is a highly personal and situationally dependent decision. Before making ANY decisions regarding the pricing of property you own, or establishing an offer price for a property you wish to own, I would highly suggest you reach out to me over phone, email or DM for a free consultation on your specific circumstances. If you don’t like me personally, I have a wonderful network of skilled agents who would be more than happy to assist you in any way they can. Please do NOT take what is written here as personal advice for your specific property/situation without consulting me directly. keenan@judylindsay.com // 204-955-0173 // @keenanb_ on Instagram
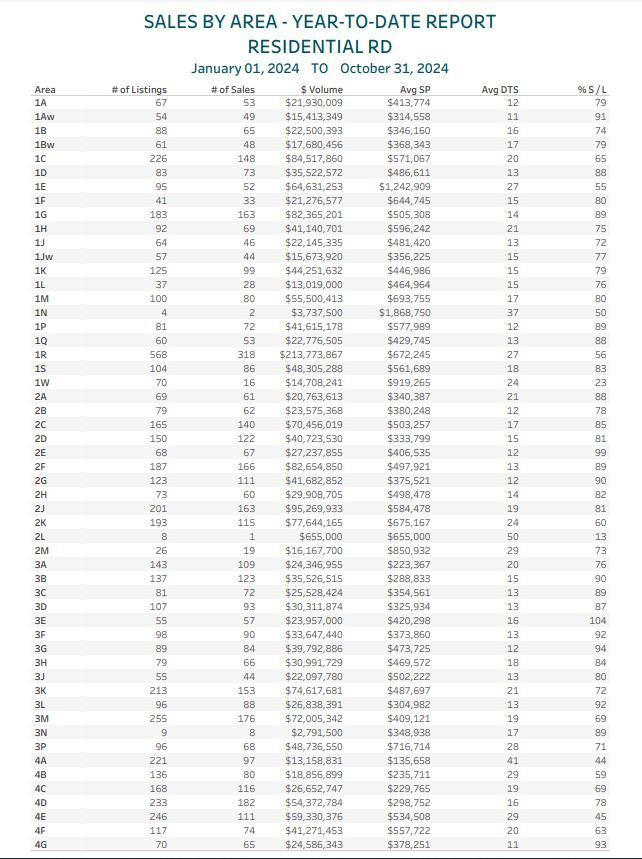
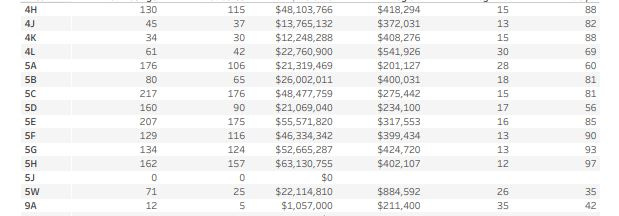
SALES BY AREA REPORT
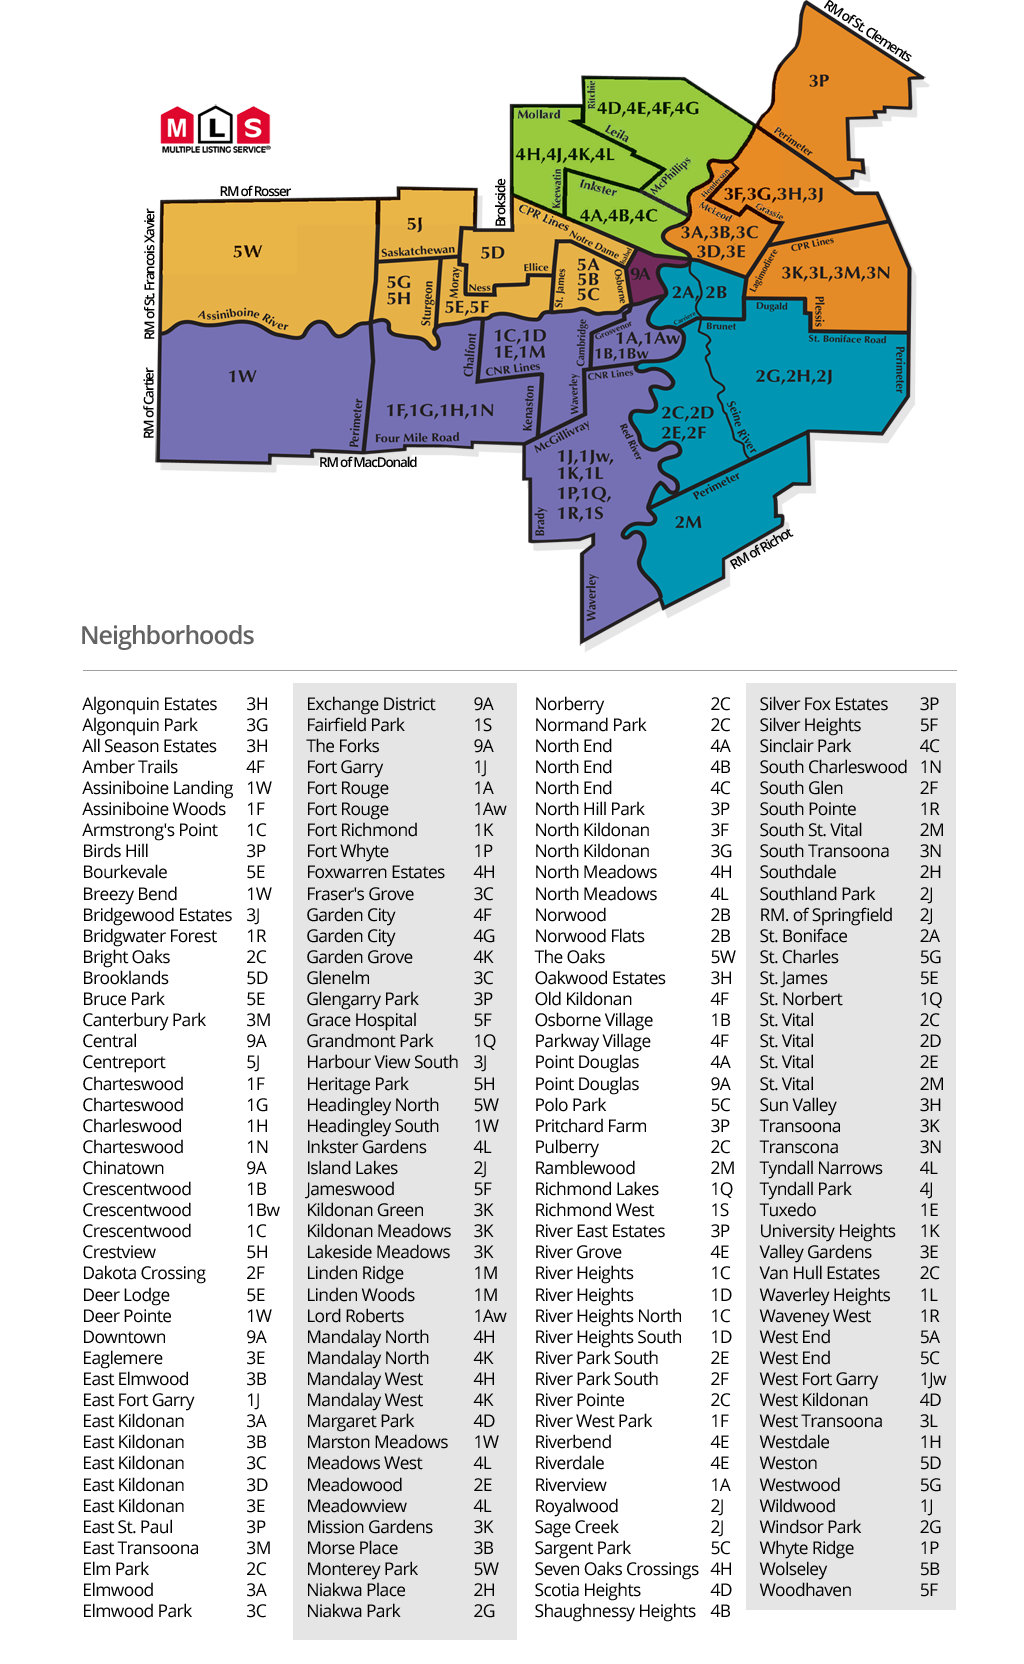
Guide on MLS area codes:
I’d classify absorption numbers as follows (From a YTD perspective):
85%+ = Extremely hot. Almost everything is selling on an offer day, not much is on the market.
70%-85% = Hot. most listings are selling, bidding wars happen, listings don’t sit long.
50-70% = Balanced. The best listings and best priced listings will sell without trouble, but greedy sellers and buyers may be in for disappointment.
35-50% = Cold. Most homes aren’t selling easily. There is likely a lot of supply on the market and most listings are stacking days on market with little attention.
< 35% = Extremely cold. The area is saturated with listings, very few properties sell quickly, very few buyers shopping in the area.
ANALYSIS
Here’s some of the hottest neighborhoods by absorption in 2024 (about 85% or higher):
1Aw - Lord Roberts - 91%
1D - South River Heights - 88%
1G - Charleswood - 89%
1P - Whyteridge - 89%
1Q - St Norbert - 88%
2A - St Boniface - 88%
2C - Old St Vital - 85%
2E - Meadowood - 99%
2F - River Park South - 89%
2G - Windsor Park - 90%
3B - Elmwood East Kildonan - 90%
3C - Glenelm/Fraser’s Grove - 89%
3D - Mid Kildonan - 87%
3E - Valley Gardens - 104%
3F - North Kildonan south - 92%
3G - North Kildonan North - 94%
3L - Transcona West - 92%
4G - Garden City - 93%
4H - The Maples - 88%
4K - Tyndall Park West - 88%
5E - St James - 85%
5F - Silver Heights + - 90%
5G - Westwood - 93%
5H - Crestview & Heritage Park - 97%
Another strikingly large list of hot areas! At this point, it might start to be easier to list all of the areas which didn’t feature 85%+ absorption rates!
With a Winnipeg Market Watch record-breaking 24/66 active Winnipeg MLS areas making the hot list, it’s safe to say most of Winnipeg has been seeing extraordinarily high activity overall.
Notably, the areas beginning in a “2” saw some very large spikes in absorption compared to previous months, including a big push upwards for 2C and 2E. With areas like River Park South and Windsor Park holding strong, and Southdale just barely missing the hot list, I’m expecting a very busy end to 2024 for this entire south/central chunk of the city.
The 3’s remain the king as we head towards the end of the year, with Valley Gardens (3E) continuing to be impossible to buy a house in, and most of the upper chunk of the Kildonans experiencing virtually every listing selling on offer night. This busy year for this greater area looks to be coming to a hot conclusion, and will likely remain robust well into 2025.
The 5’s are continuing to look really solid as well, with the usual suspects hovering around the same absorption levels they’ve had for most of the year. Interestingly, Crestview/Heritage Park (5H) has been steadily increasingly in both absorption and average price for several consecutive months, which is a huge indicator for the city benchmark, as the area is loaded with very average sized conventionally built bungalows. Expect all of 5F, 5G and 5H to be hard areas to buy in for some time to come.
Here’s a short list of neighborhoods I’m keeping a close eye on right now:
1M - Lindenwoods - (80% this month)
Lindenwoods is an area I’ve spotlighted a handful of times this year, as I have clients actively shopping here, but I also find the supply and pricing dynamic incredibly interesting. The absorption rarely gets too high, as the price point puts it as Winnipeg’s 2nd most expensive MLS area on average, yet the average sale price has lately been rising quite a lot, and most listings are continuing to sell. After a tough end to 2022 and a rough 2023 overall, it looks like the higher end of Winnipeg’s real estate market may be in for a late-in-the-year treat!
1R - Bridgwater & extended neighborhoods (56% this month)
I am going to have 1R on this list likely until at least January. I have been fascinated watching changes in builder supply and pricing strategies succeed and fail in a very crowed market with several listings trying to stand out from one another at remarkably similar price points. I am learning from the activity I’m seeing here, but also noting the lower end of the sale price spectrum, as I will be listing a very attractively priced property in 1R early in 2025.
5C - Sargent Park and the West End (81% this month)
I am also continuing to watch 5C very closely, as I almost perpetually have both buying and listing activity in this part of the city. With two active listings in the area right now, and a strong likelihood of several more in 2025, I am watching closely to see what kind of products are moving the quickest, and what types of properties are getting stuck. Understanding value and understanding the needs of the buyer is always critical when pricing listings, but it is particularly so in a finnicky area like 5C. I will be watching everything here for a while!
Takeaway:
Here are the key points from today’s market update:
The HPI index fell slightly month over month to $418,100 from $418,800 and remains down about 2.56% from the all-time high.
Supply metrics were some of the strongest we’ve seen all year, featuring significantly fewer listings than previous years and months.
Average sale price unexpectedly jumped to $427k up from $410k in September with nearly 10% more transactions occurring this month than last.
Absorption citywide remains incredibly high and is increasing at an unseasonably irregular rate.
With further rate cuts expected, and the Winnipeg market showing nearly every sign of strength possible, it is very likely our final 2 months of 2024 will be more active, feature higher prices, and feature more transactions than we’ve seen in recent November and December data dumps.
Stay tuned for the next article, leave a comment if you found this helpful, and feel free to reach out if you would like to discuss anything in further detail.