


Winnipeg Home Price Index Update - Data From January 2024
The first month of 2024 is over and the data is out! Let's see how the year kicked off for the Winnipeg housing market.
Welcome back to another market update! January is in the books, and this traditionally quiet month has outperformed the expectations of most industry experts.
A podcast version of this update will be released on Monday February 5th. Of course, the majority of the details and accompanying visuals will be found in the written article below for your reference. You can have these updates, other articles and podcasts emailed to you as they are released by subscribing using the link at the bottom (for free!).
January 2024 HPI Update
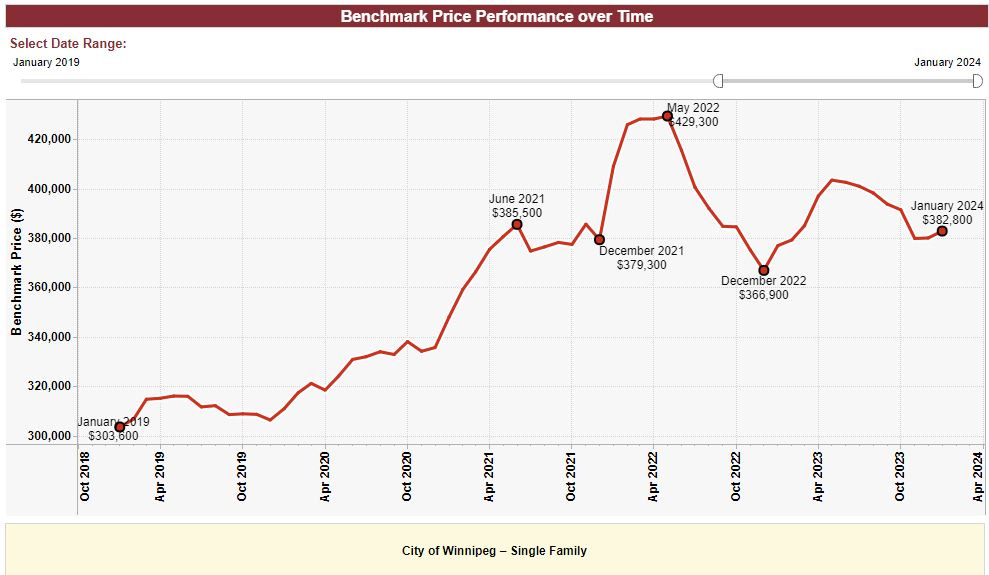
January Winnipeg Benchmark Price: $382,800 (up from December ($380,000))
Year to date: +0.74%
Month over month: +0.74%
From All-time High: -10.83% (Gain of +12.15% required to return to ATH from here)
Our unseasonably warm January brought its fair share of surprises for us this year! In addition to a nice 0.74% jump in the benchmark price, our markets supply and demand metrics are both looking quite good compared to previous years. This January kicked off the year with nearly 10% more sales occurring this past month than January 2023, January 2022, and December 2023. The trajectory our market has been on to begin the year appears to be excellent, and sentiment of both buyers and sellers appears to be significantly more positive than any time in the last 12-18 months.
Mortgage interest rates held relatively steady throughout the month of January, as no major central bank rate change announcements were made. However, both the US and Canadian central banks noted they likely would hold their target interest rates until at least June - taking any March or April rate cuts off the table for now. This news did not seem to impact the eagerness of Winnipeg buyers to get out and hit the market, as we experienced significant uptake in the current supply we have on the market. More than a handful of MLS areas currently do not have a detached home active at the time of writing (Feb 1 2024). This has created immense pressure for many buyers looking to get into their areas of interest.
In other news, January 3rd kicked off a series of rule changes regarding the advertising of off-market listings. Without going into extensive detail, the ability for Realtors to advertise property NOT listed on MLS is now far more restricted than it has been in the past. Essentially, Realtors can only share off-market listings on a one-on-one conversation basis with people outside of their office. This should (in theory) drive more listings to MLS, providing buyers with more selection and sellers with the best possible chance at getting their price - or at least that’s what the real estate board says. It still remains to be determined whether this change in rules will affect our market significantly or not.
If you’re a thinking of selling, most areas (including some of the higher priced ones) are facing very limited supply. Any interested buyers would almost surely consider whatever it is you’re advertising whether it’s what they were initially interested in or not - simply due to lack of alternatives. I believe sellers currently have a greater degree of power than they have had in past Januarys, and listing in February is likely to yield a good outcome for achieving both the price you’re hoping for and advantageous terms. This could be a golden opportunity to be one of the only listings in an entire MLS area!
If you’re a buyer, your prospects are more challenging. In most areas, prices are slowly & consistently climbing, and the impending rate cuts are expected to push prices even higher. Selection is currently very limited, and combined with a quieter than normal off-market scene has left the market with very little desirable products in many areas. Buyers now more than ever need to ensure they’re partnered with an extremely well-connected and highly experienced Realtor. Finding the exclusive options and negotiating as effectively as possible - whether you’re against multiple offers or not is the way only way to win in this market.
SUPPLY January 2024
December 2023 Data:
January 2024 Data:
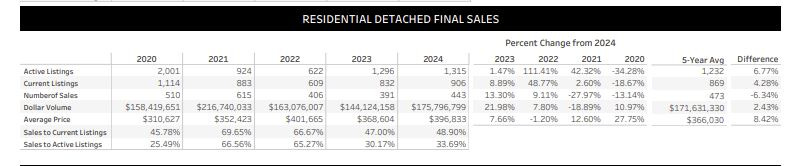
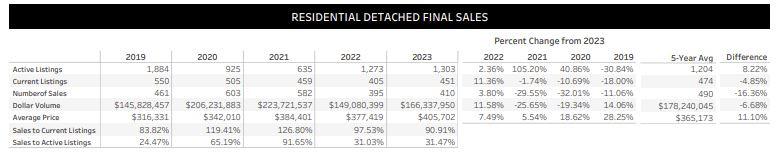
Starting off with supply, Active listings overall are roughly flat month over month as well as year over year. This is reassuring, as we seem to be following the same trend we experienced last year, which by most metrics was fantastic for our market. Current listings are slightly higher than 2021-2023, although many of these “current listings” are listings that expired on the 31st of December and were simply relisted in January. I am not reading too closely into that data just yet.
Transaction volume overall is up both month over month and year over year as well. This is a great indication that buyers feel comfortable with the prices being advertised, and are, therefore, writing offers. To me, this is an indication that prices are likely to continue to slowly climb as we move towards the peak of the Spring market. When sellers know they aren’t likely to be cornered into accepting something extremely low due to the eagerness of others to pick up the pen (or DocuSign) and write them an offer, listings tend to sell for more.
It should be noted the average sale price for January 2024 has very nearly eclipsed the average sale price of January 2022, which was a very notably lively month. January 2022 had a benchmark price of nearly $410,000 with the average sale being only $401,000. January 2024 saw a benchmark price of $382,800 with an average sale price of ~$396,800.
When the average sale price consistently exceeds the benchmark value, it’s likely the benchmark value will rise over the long term. If the inverse is consistently true, the benchmark will likely fall.
This has been the case since September 2023, although the spread was much tighter then.
Absorption Data:
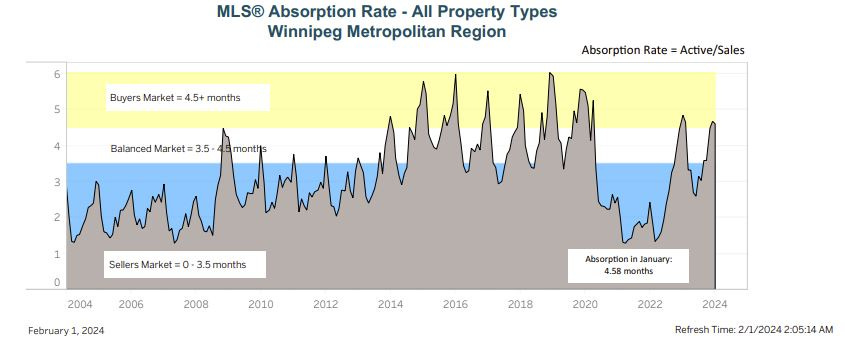
This month’s absorption chart has behaved almost exactly as expected, with absorption just barely classifying the Winnipeg market as “buyer-favored”. The slight turn back towards seller favored was expected, and will likely continue throughout the first and second quarter of the year.
“It remains my opinion that we won’t remain in the buyer favored zone for long, and a dip back down towards seller favored will occur likely sometime in the early stages of spring/late stages of winter in 2024.” - Dec 2023 update
BIDDING WARS - OVER OR UNDER
At the time of writing (Feb 1 2024) this information has not yet been released to the public by the Winnipeg Regional Real Estate Board.
In the interest of time and preparation for the recorded podcast version of the update, this section may be continuously eschewed for future updates. It will be included when available.
Please leave a comment if you’d to like to view and discuss this information when it is released.
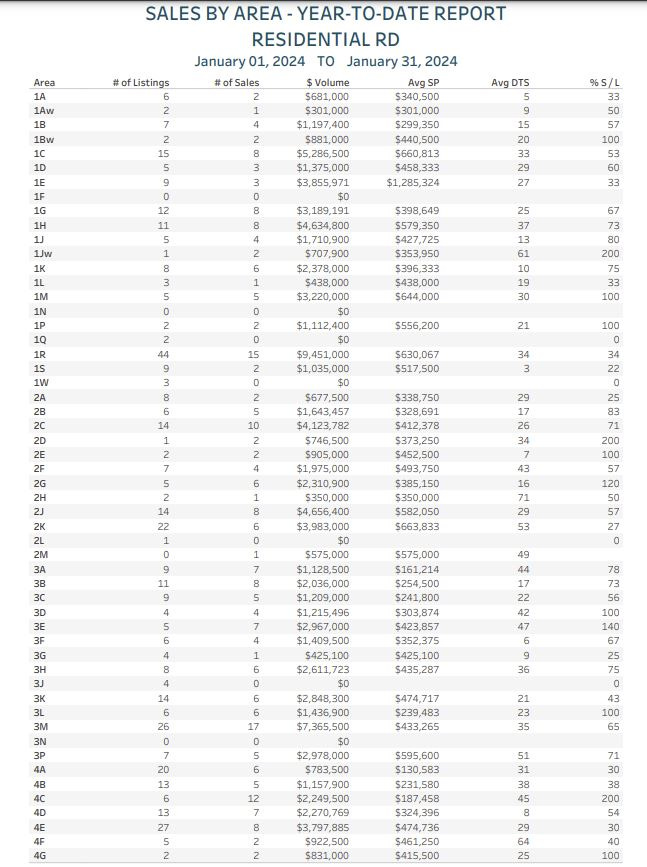
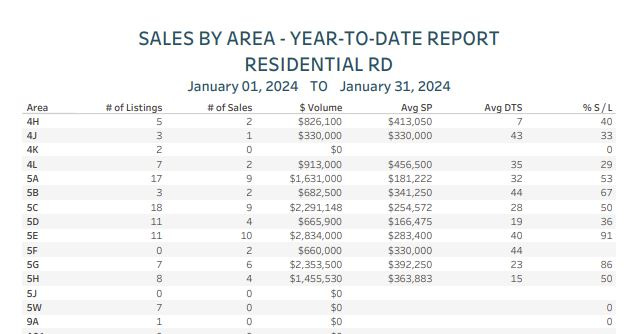
SALES BY AREA REPORT
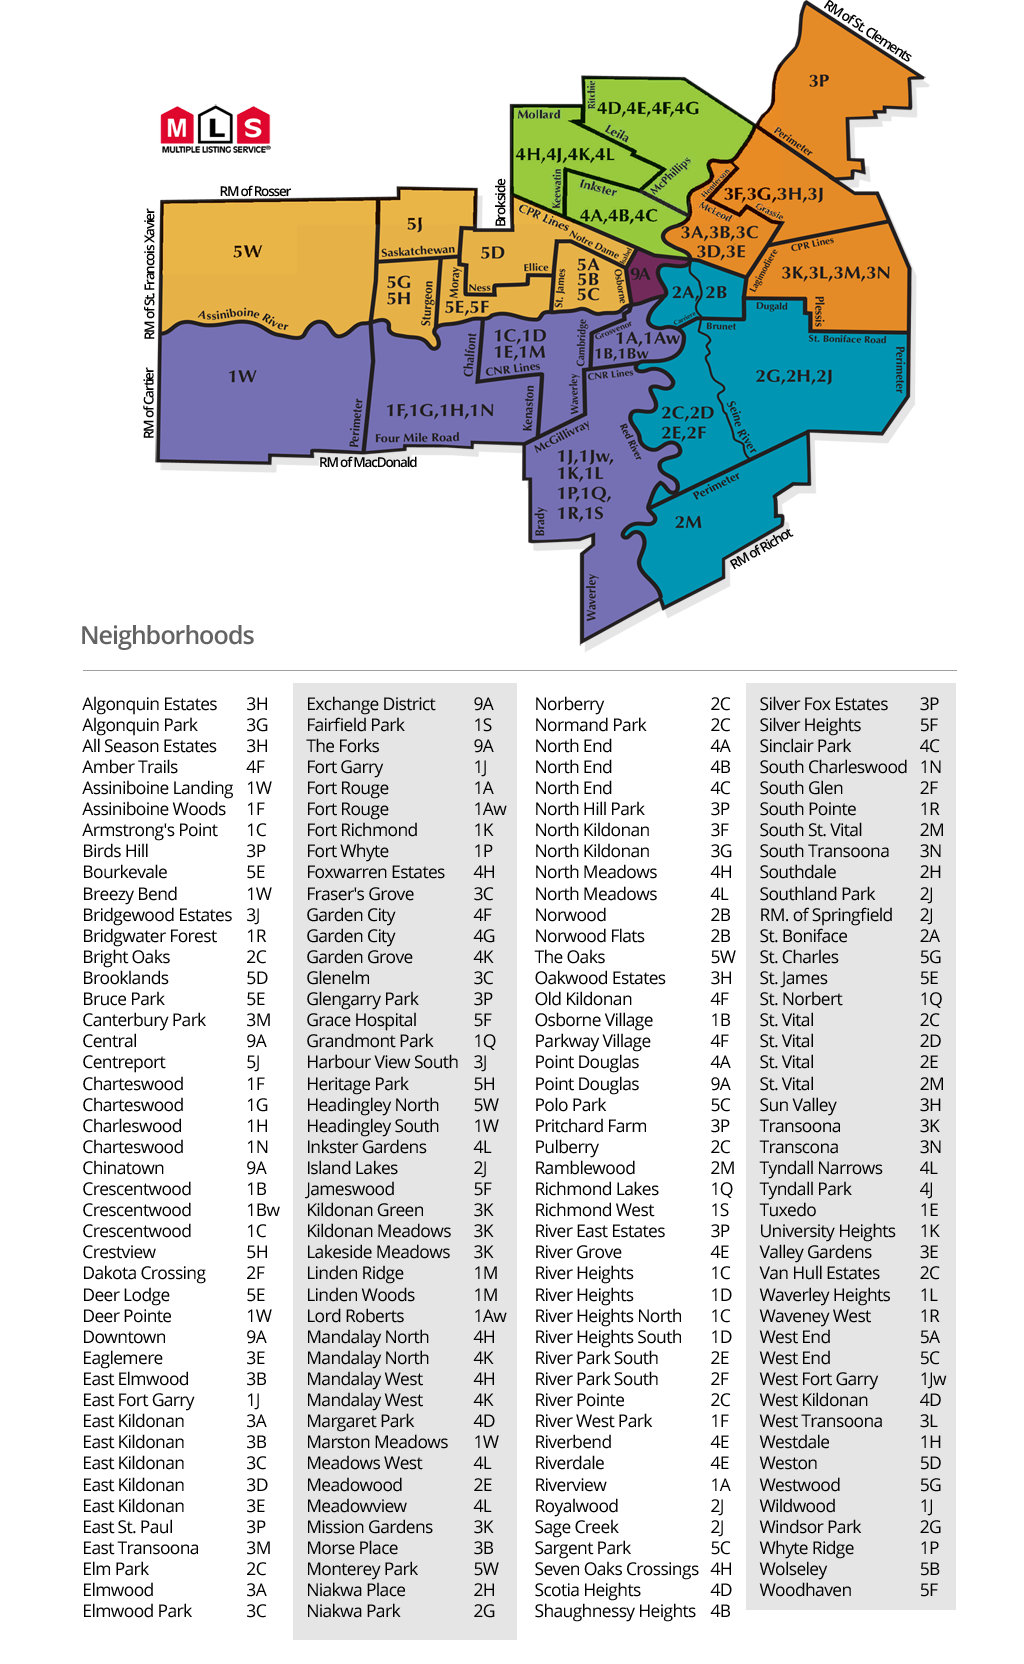
Guide on MLS area codes:
I’d classify absorption numbers as follows (From a YTD perspective):
85%+ = Extremely hot. Almost everything is selling on an offer day, not much is on the market.
70%-85% = Hot. most listings are selling, bidding wars happen, listings don’t sit long.
50-70% = Balanced. The best listings and best priced listings will sell without trouble, but greedy sellers and buyers may be in for disappointment.
35-50% = Cold. Most homes aren’t selling easily. There is likely a lot of supply on the market and most listings are stacking days on market with little attention.
< 35% = Extremely cold. The area is saturated with listings, very few properties sell quickly, very few buyers shopping in the area.
ANALYSIS
Here’s some of the hottest neighborhoods by absorption in 2024 (about 85% or higher):
4C - North End/ West Kildonan - 200%
3E - East Kildonan - 140%
2G - Windsor Park - 120%
1M - Lindenwoods - 100%
5E - Old Saint James - 91%
The following areas had fewer than 5 sales, but still experienced very high absorption:
1Jw - West Fort Garry - 200%*
2D - St. Vital - 200%*
1Bw - Crescentwood - 100%*
1P - WhyteRidge - 100%*
2E - Meadowood - 100%*
3D - Fraser’s Grove - 100%*
3L - West Transcona - 100%
4G - Garden City - 100%*
Before we dig into the data, I’d like to give a quick explanation on absorption greater than 100% - this simply means a home listed in the previous month/year sold in the current month. An absorption over 100% implies that the market may have previously had some lingering supply, but it was eaten up at a rate so significant that it outpaced new listings entering the market. This will be relatively common until we’re deeper into the year and more sales have occurred.
A few new areas have made it onto the list for the first month of 2024! Notably, 4C saw a whopping 12 sales with only 6 new homes being listed, which is extraordinary. The neighborhood is still boasting an average of over 45 days to sale, which is high, but it is nice to see so much activity so early.
Surprisingly, the very expensive Lindenwoods neighborhood saw a perfect balance of 5 homes listed and 5 homes sold in the first month of the year. This is a great indicator that the higher end of our market has stabilized and buyers and sellers are beginning to share a commensurate understanding of value. With an average sale price of $644,000, it could be the case that these January sales influence every comparable listing this spring in an extremely positive fashion.
Many other areas experienced great absorption figures, but the activity was quite limited. These areas are worth taking note of, as any listings in that area are likely to be the only one on the market at this point in time. Notably, 2E continues to have 1 active (which is actually mislabeled and should be in 2F), and has been experiencing extremely limited listing activity for several months now.
A recent listing I was involved in in 2E sold with multiple offers, had over 65 confirmed showings, and an open house with a lineup of people from the front door to the curb. The area is very, very hot.
Here’s a quick list of MLS areas without any detached homes on the market whatsoever right now:
1Aw - Lord Roberts
1F - Southboine (Charleswood north)
1Jw - West Fort Garry
1P Whyteridge
There are numerous areas with only 1 or 2 active detached homes on MLS right now.
Here’s a short list of neighborhoods I’m keeping a close eye on right now:
2E- Meadowood (St. Vital) -100%
I’ve been keeping an eye on this area for a while, and I am shocked at the lack of options for buyers in the neighborhood. There have been a total of 2 homes listed in 2024, and they both sold almost immediately with multiple offers. This kind of pressure can send prices skyrocketing, and I am deeply interested to see how this plays out.
1H - Ridgewood West - 73%
Until recently, this area was somewhat inundated with vacant lots and new construction, which kept absorption low, and forced every existing home to compete with the builders. For the first time in a considerable period, I am noticing a depleted builder presence in the neighborhood, and I believe this lack of builder supply could cause prices to move quick. It’s possible the builders simply haven’t listed their inventory yet, although I’d be surprised if they’d wait this long.
3G - North Kildonan - 25%
Many of you may remember this as one of the hottest areas of 2023, and to put it frankly, it did not get off to a great start. The data definitely doesn’t tell the full story, there are currently only 2 homes remaining on the market here, one of which is tenant occupied and the other is taking offers in several days. I have clients looking to buy around here, and I am hoping to see some worthy product get listed soon.
1M - Lindenwoods -100%
After an absolutely fantastic start to the year, I am watching this neighborhood closely for the benefit of both clients and friends. It seems buyers and sellers have begun to come to an understanding of value in the area, and most homes are selling relatively quickly once again. I’m paying close attention to not only absorption in February, but also the number of listings overall and their pricing strategy. The next month could be paramount in setting the tone for the rest of the year.
Takeaway:
Here are the key points from today’s market update:
The HPI index rose 0.74% month over month, up to $382,500 and down about 10.83% from the all-time high.
Interest rate expectations are stable for now, but many are anticipating cuts starting in June and running into late 2024/2025.
Supply metrics continue to trend in a positive direction, with many neighborhoods experiencing virtually no listings whatsoever. The market in aggregate remains relatively balanced, but is beginning to shift in the direction of seller favored.
The average sale price of detached homes in Winnipeg in January was $396,800, which is significantly higher than the current benchmark price of $382,800. This is an indicator the benchmark is likely to rise in the future.
January saw a revival in activity in some of the higher price categories in the city. The main price point of growth and activity continues to be somewhere around roughly $325k-$425k
Stay tuned for the next article, leave a comment if you found this helpful, and feel free to reach out if you would like to discuss anything in further detail.