


Winnipeg Home Price Index Update - Data From May 2024
Another solid month of data for the Winnipeg real estate market. With a rate announcement looming and seasonality about to take effect, will the market be able to keep it up?
The May 2024 data is in and we’re back to break down all of the data.
A podcast version of this update will be available on June 10th 2024, which will feature our expert analysis on the rate decisions being made this week in Canada and the US and their implications on our market. As always, if you find these updates helpful, please subscribe (it’s 100% free and always will be!)
May 2024 HPI Update
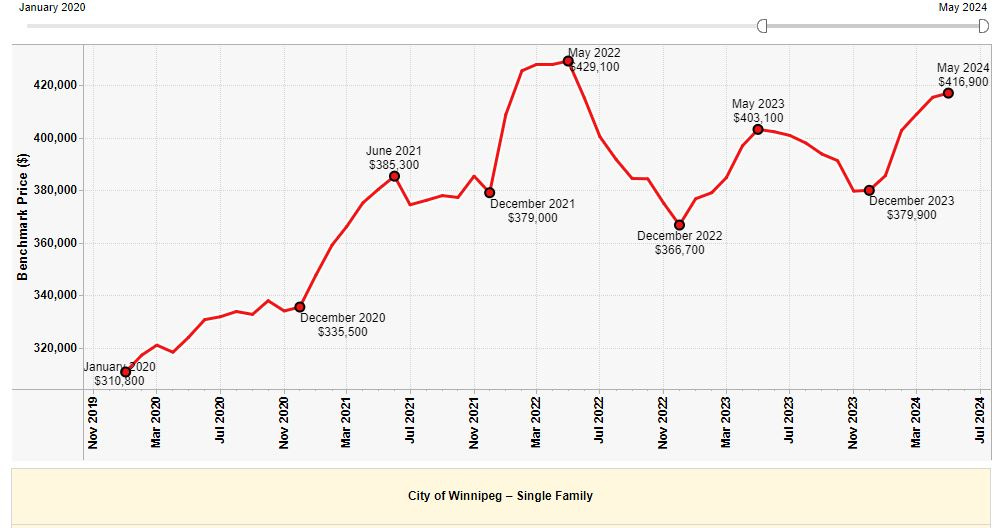
April Winnipeg Benchmark Price: $416,900 (up from $415,300 in April))
Year to date: +9.74% (Was +9.53% last month)
Month over month: +0.39% (Was +1.54% last month)
From All-time High: -2.84% (Gain of +2.93% required to return to ATH from here)
The May data is in, and things are still looking great for Winnipeg real estate! With the benchmark price continuing the rise heading into the big interest rate announcements in Canada and the US early in June, market participants in our city continued to keep things moving in what is traditionally one of the busiest months in our city every year. Most interestingly, the supply metrics for May were particularly strong, most of the pricing data appeared solid, and the absorption numbers came out more seller favored than expected, yet the average sale price declined month-over-month, and the benchmark only rose modestly. With a very important interest rate announcement coming this week, the question on everyone’s mind is “where will things go from here?”
As I’ve stated several times in the past, the Winnipeg real estate market is less impacted by swings in interest rates/central bank policy meetings than other parts of Canada and the world. This is due to the majority of Winnipeg real estate being owner occupied, with only a relatively small minority trading in the market for the purpose of investment. That being said, the June policy meeting for both Canada and the US will likely be one of the most important meetings of the year. Both countries have “promised without promising” that interest rate cuts would begin with the June meeting, and a series of small cuts would follow from that point forward. Despite these comments made earlier in the year, it is the opinion of many industry participants that rates will either A.) stay the same at this June meeting, which some speculate will be devastating for expensive markets barely holding (looking at the far reaches of the GTA…), or B.) a small cut will occur and everything will be all hunky-dory.
At the time of writing, June 3rd 2024, I am not expecting the US central bank to cut interest rates, as their markets seem strong and growth is continuing without need for assistance, while I am completely unsure what the Canadian central bank will do. Typically, the Canadian central bank tends to follow in near lockstep with the US, but our national situation regarding employment, real estate and our markets in general is certainly less strong than theirs. For that reason, I think it is very likely we see the beginning of rate cuts in Canada, but I do not think the US will cut on the 6th. Feel free to comment on this post on the 7th and make fun of me for being wrong!
Interest rate discussion aside, the Winnipeg market is almost certainly near or at the high point for the year. Whether rates go up, down or sideways, it’s very rare for any month besides April-June to feature the yearly high in pricing. With this in mind, it is critical for those looking to sell to make one last push before summer. For those looking to buy, understand this might be the best time of year to have the widest selection possible, but it will come with a price. There could be great deals to be had if you’re less picky about the product and willing to wait until later in the year.
SUPPLY May 2024
April 2024 data:

May 2024 Data:
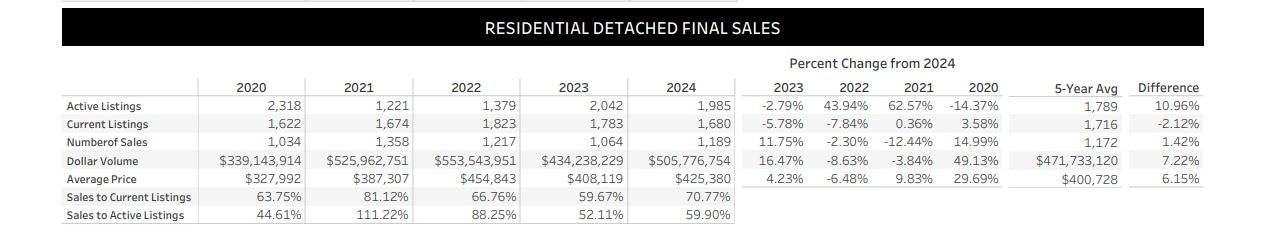
The May data does an excellent job of illustrating just how well the Winnipeg market is performing in relation to 2023, with both active and current listings down from last year, number of sales WAY up (11.75%!!) and dollar volume up a massive 16.47% with over 500M in residential detached real estate trading hands this month alone. Month over month, May featured more listings than April, but a precisely commensurate increased in number of sales to boot. This indicates the level of supply compared to level of demand is reasonably balanced.
This May featured an average sale price of $425,380, which marks the first month of 2024 where our average sale price declined. This value is still higher than the current HPI, which is always a good indicator that things are going well for the market and momentum (and pricing) is going to continue to rise. Given this decline, I would consider this the first indicator that we may be approaching the top level of pricing for 2024, which is normal given the time of year.
Absorption Data:
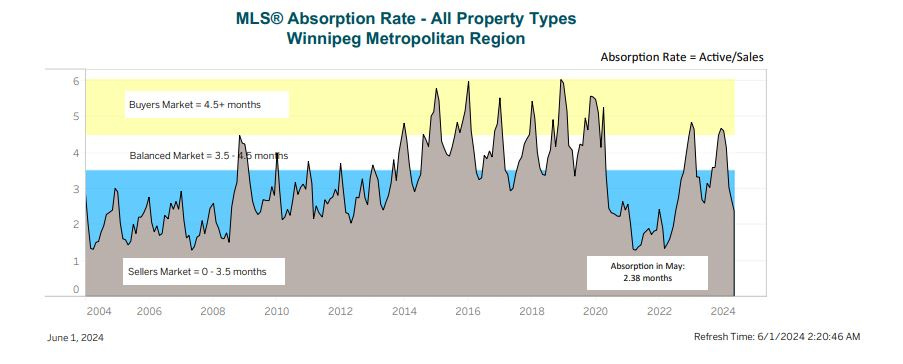
May absorption took a huge leap deeper into seller favored territory, which is interesting compared to the relatively modest increase in the HPI. The absorption chart pictured above often takes some time to adjust as the definition of “Seller favored” speaks about number of months to achieve a sale, and we are looking precisely at 1 month’s worth of data. I still expect another 2-3 updates to have data solidly in the seller favored side of the chart, but I wouldn’t be surprised to see it continue to run even slightly longer than that.
BIDDING WARS - OVER OR UNDER
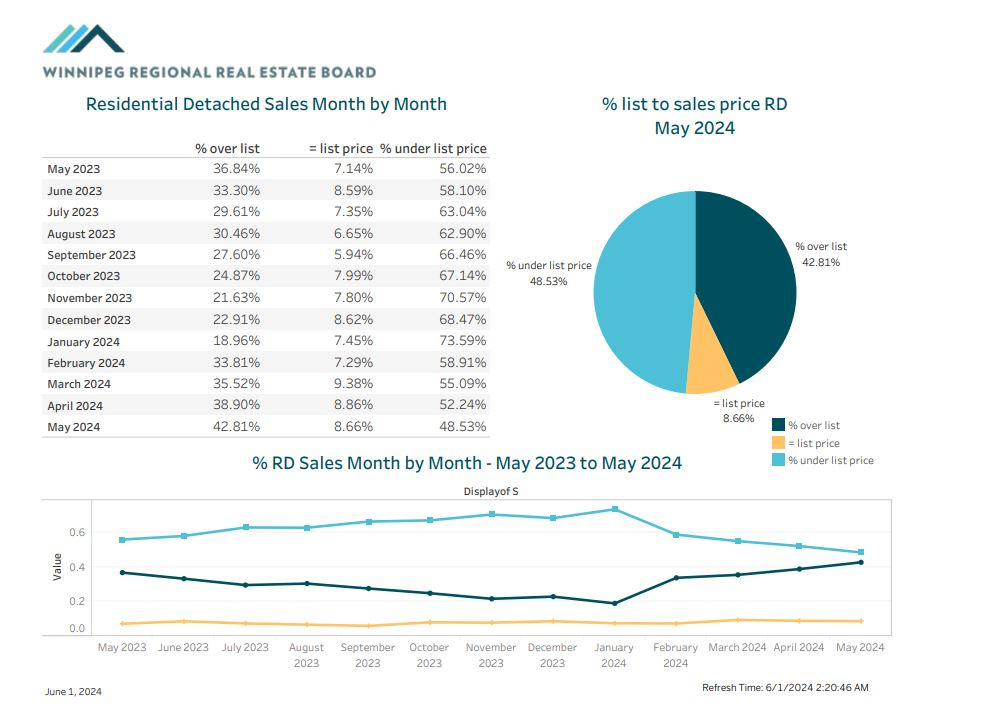
Bidding wars seem to be the way of the world in Winnipeg Real Estate! In May, we saw ~51.5% of homes sell at or above asking price, which is the most we’ve seen since early 2022. The prevalence of bidding wars is somewhat of a chicken and egg situation in the current market: seller’s know buyers psychologically add ~10% to every asking price they see, and buyers know sellers ask ~10% less than they’re hoping for on every house they list. It’s almost as if the words “offers anytime” don’t mean anything anymore - buyers STILL behave skittish on property available to purchase throughout on a moment’s notice. With this in mind, it is extraordinarily hard for the market to do a wholesale restructuring of asking vs sale prices until things begin to cool down and mutual expectations of buyers and sellers coalesce under the typical “summer pricing paradigm” - which usually begins sometime in the middle of summer and can be observed when sellers begin consistently asking for the high prices of the neighborhood with offers anytime instead of the generic “everything in the entire neighborhood is $399,900 and taking offers next week!” strategy we’re seeing today.
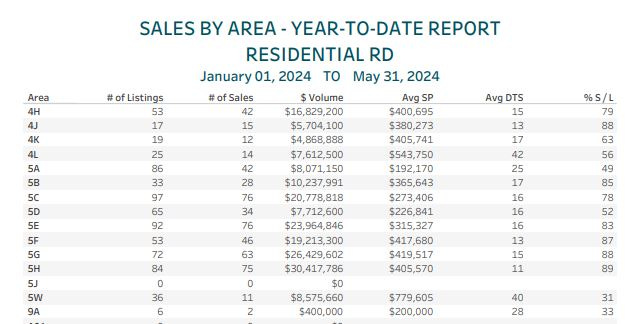
SALES BY AREA REPORT
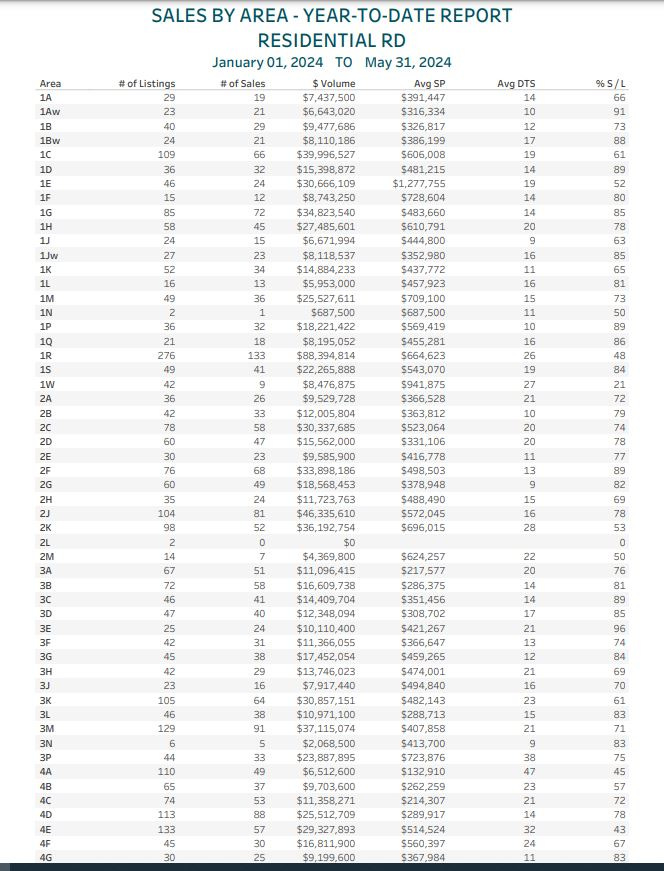
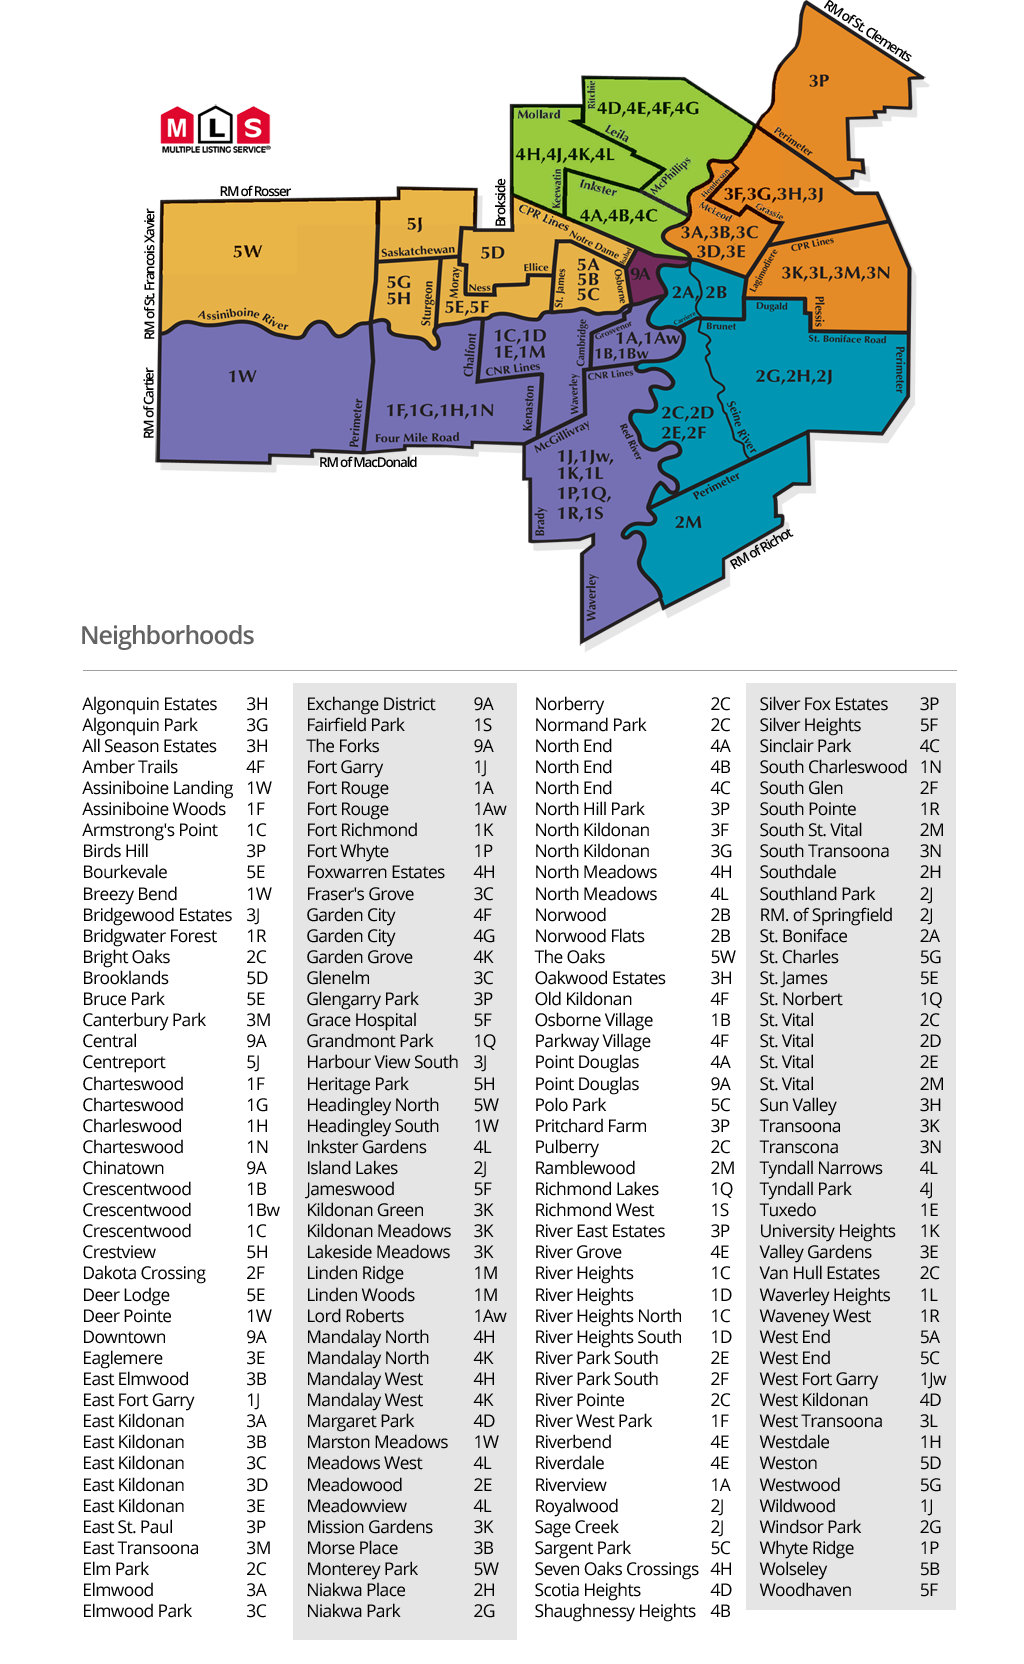
Guide on MLS area codes:
I’d classify absorption numbers as follows (From a YTD perspective):
85%+ = Extremely hot. Almost everything is selling on an offer day, not much is on the market.
70%-85% = Hot. most listings are selling, bidding wars happen, listings don’t sit long.
50-70% = Balanced. The best listings and best priced listings will sell without trouble, but greedy sellers and buyers may be in for disappointment.
35-50% = Cold. Most homes aren’t selling easily. There is likely a lot of supply on the market and most listings are stacking days on market with little attention.
< 35% = Extremely cold. The area is saturated with listings, very few properties sell quickly, very few buyers shopping in the area.
ANALYSIS
Here’s some of the hottest neighborhoods by absorption in 2024 (about 85% or higher):
1Aw - Lord Roberts - 91%
1Bw - Crescentwood - 88%
1D - South River Heights - 89%
1G - Charleswood - 85%
1Jw - Fort Gary - 85%
1P - Whyteridge - 89%
1Q - St Norbert - 86%
2F - River Park South - 89%
3C - Glenelm & Fraser’s Grove - 89%
3D - Mid Kildonan - 85%
3E - Valley Gardens - 96%
4J - Tyndall Park East - 88%
5B - Wolseley - 85%
5F - Silver Heights & Woodhaven - 87%
5G - Westwood - 88%
5H - Crestview - 89%
First of all, I’ve been asked to sort this list by MLS area instead of by absorption percentage. If you don’t like this change, please let me know!
This update featured some really incredible numbers from across the city with a couple of noticeable trends beginning to emerge.
Probably the biggest standout point of this update is the continuation of the massive absorption occurring in the southern parts of North Kildonan and Valley Gardens (the more affordable parts of the greater neighborhood referred to as “the Kildonan’s”). For you long time readers out there, you may recall 3F and 3G completely dominated this list for almost all of 2023, and the money is flowing to the most immediately nearby areas possible. This growth story is a testament to the desirability and long term future of the greater neighborhood at large going forward. It is very exciting to see. Once these areas hit saturation, I expect capital to begin flowing into some of the better parts of 3B and some of the currently less-desirable parts of 3C.
In other positive news, the entire western chunk of Winnipeg appears to be killing it! With areas spanning as far as 5C all the way to the West Perimeter featuring stellar absorption, it’s clear to me that - at least for now - west is best in the eyes of the buyers. The conveniences, safety, utility and features of this area combined with affordability and strong product diversity are incredibly appealing for all kinds of homebuyers, and the numbers are there to show it.
The entire section of the city beginning with “4” (IE: the north west) has been held down for quite some time this year, with pricing only increasing modestly, and many homes taking far longer to sell than they did in 2023. For those of you who have been reading for a while, you’ll know I’ve considered all of 4E to 4L incredibly overpriced for quite some time, as the quality of product for the prices being asked are simply not worth it when compared to any other corner of our city. It appears the market is waking up to that, and refusing to guarantee the sellers in those areas the above-asking outcome they were hoping for as consistently as elsewhere.
Here’s a short list of neighborhoods I’m keeping a close eye on right now:
4D - West Kildonan and Scotia Heights (78% this month)
This area has been one which I’ve felt is overlooked in many cases, but the 2024 numbers are showing it to be stronger than it has been in the last while, particularly on the Scotia side! I will be going into June with 2 listings in the area, and I’ve carefully been noting the activity to see where things end up heading.
5G - Westwood (88% this month)
I’m currently shopping with a few buyers in 5G, and I despite the slight gaps in budget, it feels like almost everything is listed at the same price and allowing bidding wars to take them home. Currently, there are 7 homes for sale in Westwood listed between ~390 and 430 all with offer dates. I am watching carefully to see when the market determines pricing accurately to the nearest $5,000 becomes relevant again, as that moment in time could be the magic moment for a great deal to be snagged by a buyer.
5C - Sargent Park and the West End (78% this month)
Given the huge number of upcoming listings and buyers shopping in 5C, I have been watching this area’s every move! 5C is traditionally one of those particularly large areas from a geographic standpoint, and that sometimes hurts it’s numbers, yet statistically speaking it’s done a wonderful job of at least keeping pace with the city as a whole, or even outperforming many similar areas in many cases. Expect to see a handful of listings with “Keenan Brown” signs in 5C this June! (and be sure to message me if you’re looking at buying in the area!)
Takeaway:
Here are the key points from today’s market update:
The HPI index rose 0.39% month over month, up to $416,900 and down about 2.84% from the all-time high.
Supply metrics were very strong in May, with commensurate demand being present for the slight increase in supply month over month. Year over year, this May was far stronger than May 2023 in every category.
Bidding war prevalence has increase once again! roughly 51.5%+ of detached homes in Winnipeg sold at or above asking price in April 2024, which remains the most since rates were below 2%.
The city on average seems to have very hot pockets where listings are going completely crazy, while other areas appear to be much more mellow. Different buyers looking in different places may have completely opposite experiences.
Stay tuned for the next article, leave a comment if you found this helpful, and feel free to reach out if you would like to discuss anything in further detail.