


Winnipeg Home Price Index Update - MARCH 2025: Data From FEBRUARY 2025
Welcome back to the all-time high! Any questions?
FEBRUARY 2025 HPI Update
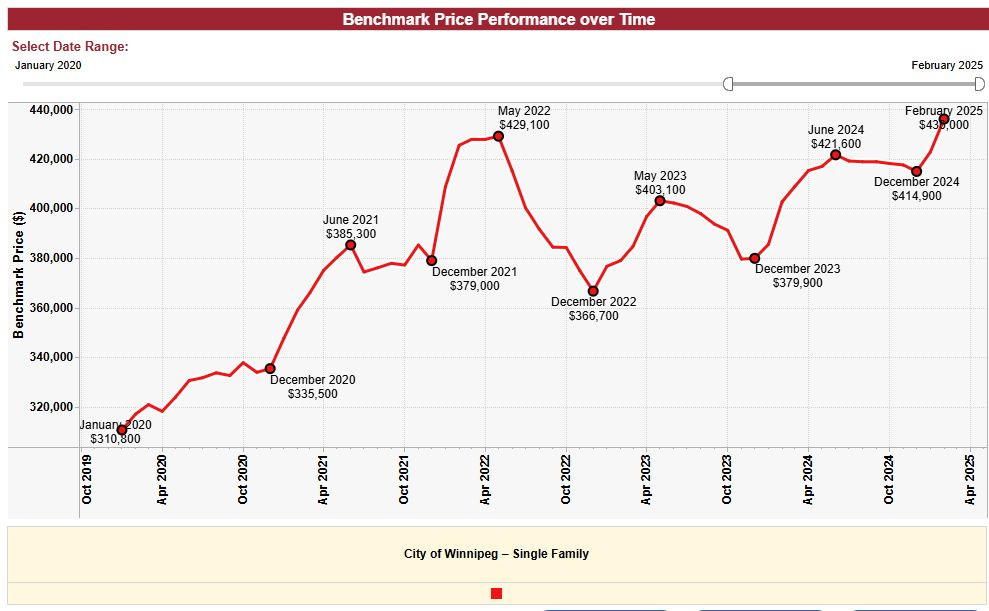
FEBRUARY 2025 Winnipeg Benchmark Price: $436,000 (up from $422,700 in January)
Year to date: +5.09% (was 1.88% last month)
Month over month: +3.15% (was 1.88% last month)
From 2024 High: +3.42%
From All-time High: +1.61%
I won’t say “I-told-you-so!” but oh boy, we are so back! The February data is out, and the Winnipeg real estate market has delivered in a massive way. The benchmark price surged by 3.15%, surpassing the May 2022 all-time high and outpacing the 2023 and 2024 summer peaks. Additionally, strong supporting data on supply, transaction volume, pricing averages, and absorption all indicate further price growth and a very busy Spring season ahead.
Broader Context: What happened in February?
Beyond local market conditions, three major external factors shaped February 2025:
Continued bizarre and escalating political tension between Canada and the U.S.
Overall economic data improving, leading to expectations of future rate cuts.
Mild sell-offs in other asset classes, including stocks and crypto.
While the early-February tariff threat never materialized, discussions are ongoing, and as of March 3rd, tariffs may or may not be implemented as early as tomorrow. The impact on global markets—and our real estate market—remains to be seen.
The Bank of Canada: Next announcement March 12th
With most buyers anticipating a rate cut on March 12th, there’s a solid chance even more liquidity will flow into Winnipeg’s already tight low and mid-market segments, likely pushing the benchmark even higher.
While the BoC did not adjust rates in February, overall economic data aligned with their expectations. They will likely either:
Stay the course, cutting rates gradually.
React to tariffs and economic shifts with policy action, such as QE or larger rate cuts.
Either way, borrowing costs are expected to continue falling in the short term.
Advice for Buyers and Sellers in Today’s Market
For Buyers:
It’s showtime, and It’s possibly the most competitive Spring market since rates were below 2%. Supply remains tight, and competition is fierce. If you’re an investor, here’s some advice (homebuyers, please DM me for personalized recommendations.):
Don’t be afraid to push slightly past the comps. Be cautious, but adding a bit to 2024 valuations isn’t unreasonable.
Move quickly. We don’t know how long this market will last. In case of a sudden shift, you’ll be glad you acted fast.
Don’t ignore the MLS. This time of year, overlooked properties can present great BRRRR, flip, or rental opportunities.
For Sellers:
Sellers, it’s showtime for you too! The weather is warm, the buyers are out, and they’re bidding up almost everything. My main tip is to try creative methods of creating urgency for force buyers into rushed decisions, and force them to ignore the sometimes numerous offer dates on similar houses across the neighborhood.
This year, I have had really solid success listing high, delaying showings, and then taking offers as-received. You get all of the benefit of an offer day, with agents and buyers lining up to get in the very second the house is available to be seen, but you pull all the attention away from the 3 houses with Tuesday evening offer dates.
This strategy isn’t always the best way to do it. There’s a time and a place for everything in Real Estate. Don’t get attached to the idea that you MUST list low and run an offer date strategy. It might be right for you and your situation, but it isn’t the only way.
Regarding market timing: If you’re planning to sell, your personal circumstances should dictate your timing more than the broader market. That said, listing earlier in the Spring market often results in stronger outcomes, as comparable sales data is more limited and buyers are willing to pay more in an upward-moving market. For those on the fence to whom time is of little consequence, there remains merit to listing sooner rather than later.
SUPPLY FEBRUARY 2025:
January 2025:
February 2025:
Supply in February fell lower than past years, but the rate of new listings coming to market is perfectly consistent with the 2022-2024 data. Month over month, supply is up slightly, but by quite a lot less than many expected.
With transaction volume jumping upward starkly, the average sale price skyrocketing, and sales-to-actives being higher than anytime since the pandemic era, the Supply picture for detached homes couldn’t be more bullish for Spring 2025.
Absorption Data:
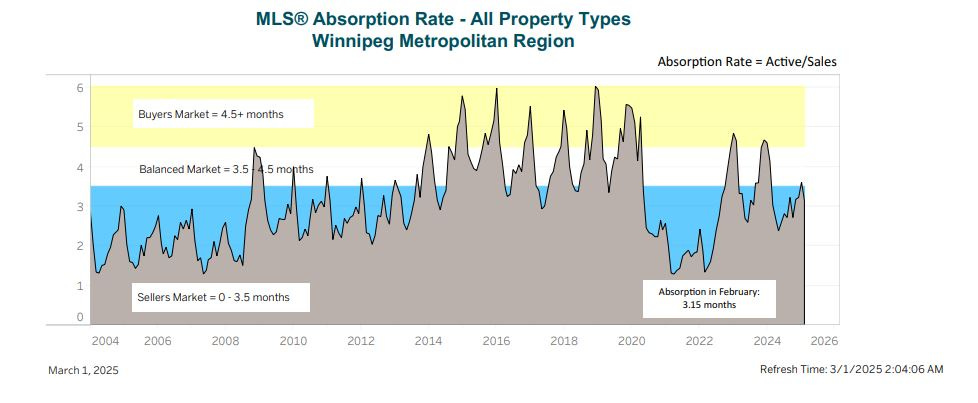
The all property type absorption citywide jumped back into seller market territory after a brief and very slight touch into the balanced market section.
With 3.15 month’s of supply, and transaction volume occurring at the rate which it is, I am anticipating a continuous dive into deep seller-favored territory by the end of the Spring season.
BIDDING WARS - OVER OR UNDER
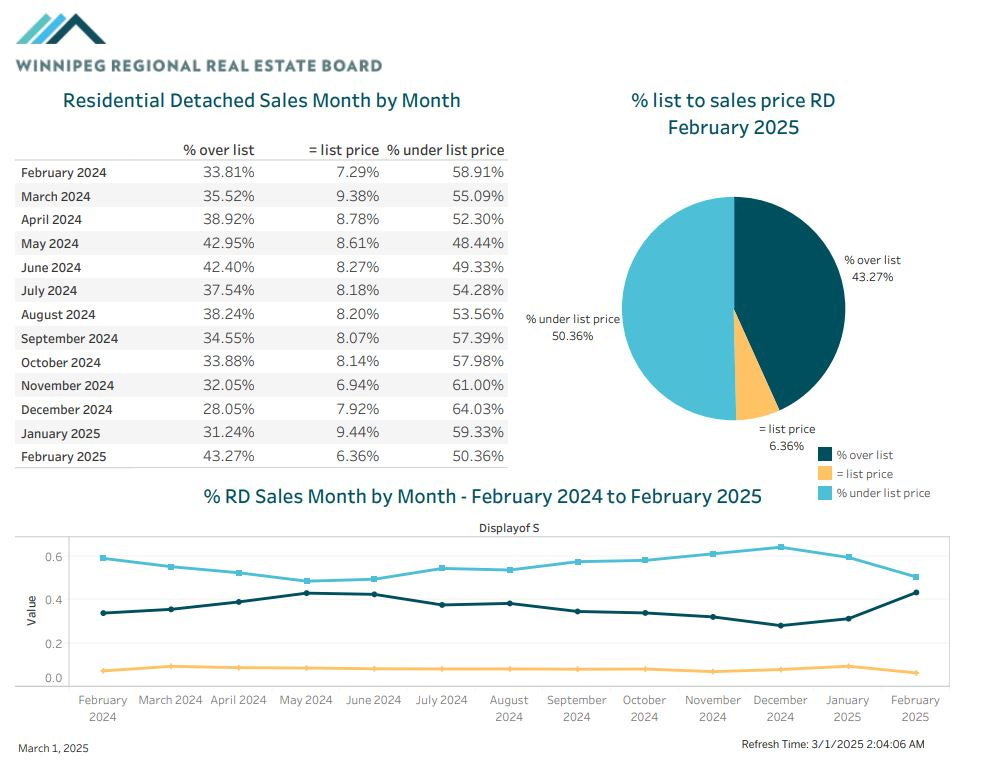
With just shy of 50% of homes selling at or above asking price, a figure we haven’t seen since 2022, we are clearly in a very hot, and very active Spring market.
As I alluded to previously, it has become very popular for sellers and their agents to work with a “Spring Strategy” — listing at the low end of value, showing for a week, and collecting offers on a set day and time. This is clearly successful for many sellers, particularly in the middle section of the market, but the craziest part is, many of these “at or above asking” sales did not even occur as a result of an offer date strategy.
In my own business, this February I managed to execute 4 sales on the listing side, none of which had an offer date, but three of which sold for more than asking price. I’m sure I’m not the only one who’s experienced this either. To me, this alongside the strong benchmark gains are the biggest sign these pricing gains are real and are not only likely to stay, but continue for several months to come.
Author’s Note: Pricing strategy is highly personal and situational. Before making any pricing decisions—whether buying or selling—reach out for a free consultation:
📞 204-955-0173
📧 keenanbrownrealtor@gmail.com
📱 @keenanb_ on Instagram
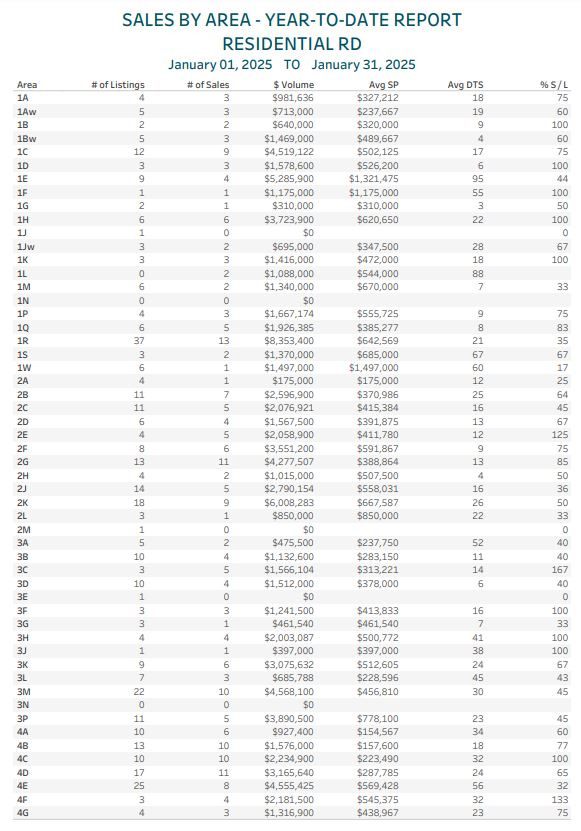
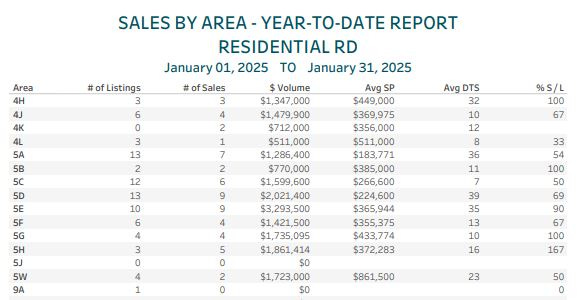
SALES BY AREA REPORT
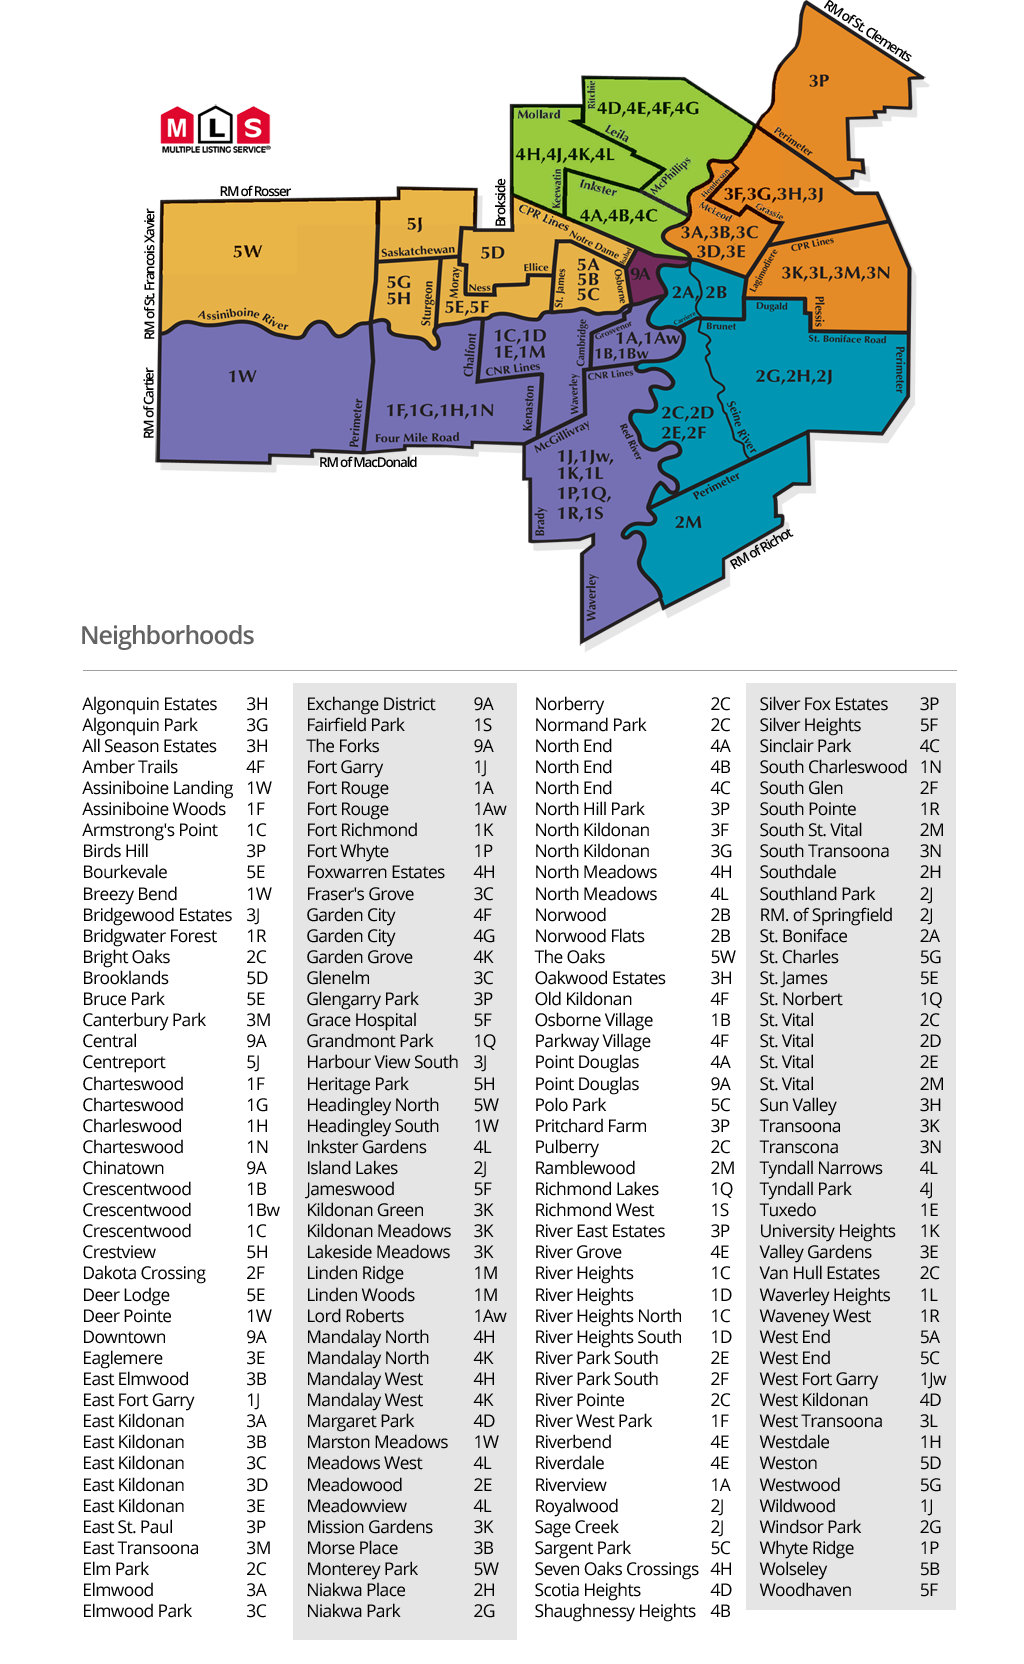
Guide on MLS area codes:
I’d classify absorption numbers as follows (From a YTD perspective):
85%+ = Extremely hot. Almost everything is selling on an offer day, not much is on the market.
70%-85% = Hot. most listings are selling, bidding wars happen, listings don’t sit long.
50-70% = Balanced. The best listings and best priced listings will sell without trouble, but greedy sellers and buyers may be in for disappointment.
35-50% = Cold. Most homes aren’t selling easily. There is likely a lot of supply on the market and most listings are stacking days on market with little attention.
< 35% = Extremely cold. The area is saturated with listings, very few properties sell quickly, very few buyers shopping in the area.
ANALYSIS
Here’s some of the hottest neighborhoods so far this year. Unlike most updates, many areas haven’t had much transaction volume yet this year. I will include only areas with at LEAST 5 SALES YTD.
1D - South River Heights - 89%
1H - Westdale/Ridgewood - 92%
1M - Lindenwoods - 88%
1Q - St. Norbert - 100%
2E - Meadowood - 138%
2F - River Park South - 88%
2H - Southdale - 90%
3C - Glenelm - 133%
3H - Springfield/All Seasons - 117%
3L - Transcona West - 87%
4C - North of Mountain, South of Inkster - 92%
4D - West Kildonan/Scotia - 96%
4G - Garden City -100%
4J - Tyndall Park East - 88%
5B - Wolseley - 100%
5C - Sargent Park - 89%
5E - St James - 126%
Next month, my quarterly area absorption analysis will provide a deeper dive into market trends, but for now, several areas have absorption rates not seen since 2022.
Some true shockers to me include 5C sitting at an 89% absorption rate with sub 30 days to sale and very reasonable transaction volume to back it up. Along the same lines, both 4C and 4D are sitting at absorption levels we literally have not seen since the absolute peak of 2022. This could be a sign of sections of the market seeking to buy any area within their budget, partly due to the strong pressure on what were once considered Winnipeg’s ideal starter home areas.
2E Meadowood, 3C Glenelm, 3H All-Seasons, 4G Garden City and 5B Wolseley are all sitting comfortably at perfect absorption or better. If you’re looking to buy in those areas, best of luck!
Some very expensive areas have started off the year particularly hot too, including 1M Lindenwoods, 2H Southdale, and 2F River Park South — all boasting great absorption, super low days to sale, and super high average sale prices. Keep an eye on these in the coming months!
Here’s a short list of neighborhoods I’m keeping a close eye on right now:
4D - West Kildonan/Scotia (96% this month)
4D is not an area you’d typically associate with ultra high absorption, but as a resident of the area myself (I love living in Scotia Heights!) I am not surprised to see buyers picking up the incredibly affordable listings throughout the area. 4D was stigmatized for most of it’s existence due to it’s proximity to some of Winnipeg’s worst areas. For those willing to look a little closer, it’s a very safe area full of young families, parks, schools, walking trails and awesome community centres for rock bottom prices!
2F - River Park South (88% last month)
With a nice listing coming up in this area, I began to take a closer look at the way this market has behaved year to date. I am very happy with what I saw! Low volume, but outrageously high activity on virtually all properties. Most homes have sold very quickly, and usually for far above asking. A very exciting area to be selling into!
5C - Sargent Park and the West End (89% last month)
What a month 5C just had! With very significant buy-side pressure, and a very upward market, 5C will likely to continue to act as a haven for buyers seeking more affordable, safe starter homes. The strong start to the year and the climbing average sale price might mean the affordability may not be around to stay forever!
Takeaway:
Here are the key points from today’s market update:
The Benchmark Price rose 3.15% month over month to $436,000, catapulting our market past the May 2022 all-time high.
Absorption remains strong, with many areas starting 2025 at absorption levels we haven’t seen since the peak of the pandemic craziness
Bidding wars are back and bigger than they’ve been in years! Nearly 50% of detached homes sold at or above asking price in February 2025.
For deeper insights, read my Performance Analysis and 2025 Predictions articles. Next edition coming April 2025.
Need advice? Let’s chat!
📞 204-955-0173
📧 keenanbrownrealtor@gmail.com
📱 @keenanb_ on Instagram
Podcast Announcement:
A podcast version of this update will be available the week following Sunday, March 9th, featuring returning guest Taylor Keast - the BRRRR beast! Taylor will join Denzel and I to discuss the new all-time high, the challenges of buying in a tight market, and business scaling strategies for young entrepreneurs.
As always, if you find these updates helpful, please subscribe—it’s 100% free and always will be!