Winnipeg Home Price Index Update - Data From SEPTEMBER 2024
With pricing holding steady, the Winnipeg market is showing incredible strength in the late stages of the year. Is it too early to know if we are in for a repeat of Winter 2021?
A podcast version of this update will be available during the week following Sunday Oct 6th, which will feature local BRRRR expert - Taylor Keast. As always, if you find these updates helpful, please subscribe (it’s 100% free and always will be!)
SEPTEMBER 2024 HPI Update
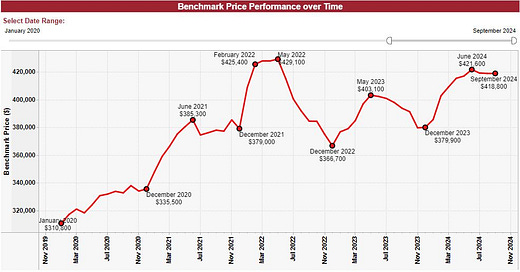
SEPTEMBER Winnipeg Benchmark Price: $418,800 (flat from $418,800 in August))
Year to date: +10.24% (Was +10.24% last month)
Month over month: 0.00% (Was -0.07% last month)
From 2024 High: -0.66%
From All-time High: -2.40%
Welcome to Q4! The Winnipeg real estate market had a solid September, posting an identical benchmark price to August. This type of movement is uncommon of the late stages of the calendar year. Historically speaking, October thru to December tend to post pullbacks between 1 and 3%. The market holding pricing flat is an almost shocking sign of strength, but unfortunately, pricing is only a part of the picture.
While it’s easy to speculate as to why pricing has held steady, there are a number of factors at play which all likely play a small part rather than one individual factor making the entire difference. Some may suggest the unseasonably warm weather we experienced resulted in more “summer-like” behavior in the marketplace, and drove more buyer activity than usual. Others may point to the supply picture, as October 2024 is sitting with ~9% less active listings than 2023 or 2022. And of course, many may point to the recent interest rate cuts in both Canada and the US as evidence that significantly more action is on the way, and buying now will look incredibly smart in 6-9 months.
I’d suggest the truth is somewhere in the middle. I believe all of these things are driving the market harder and further than we’d see in a normal October, but if the pandemic taught us anything, you should know there’s no such thing as “normal” markets anymore.
From a macroeconomics perspective, the outlook in the early stages of October remains rather positive despite a very action-packed September. Geopolitically, we had almost a full year of drama in the last 30 days, including but not limited to a severe escalation of conflict in the Middle East, a dissolution of the NDP/Liberal coalition government resulting in two subsequently rejected non-confidence votes, a half-point interest rate cut by the US Federal Reserve, alongside all of the usual antics and drama that come with a US Presidential election a month away.
Despite all of this action, the consensus opinion appears to remain the same: rates are still likely to come down further in 2025. It remains my opinion that the Winnipeg detached home price benchmark will eclipse its May 2022 high at some point in 2025.
In the shorter term, the question on the minds of most investors remains: What will the last few months of 2024 bring us? Are we in for a levelling off throughout the Winter like we saw in 2021, or are we going to experience something more reminiscent of 2023? As usual, we have a lot of data to sort through to come to a proper conclusion, but thankfully, I’m here to do the work for you!
SUPPLY September 2024:
August 2024 Data:
September Data:
The September supply data was strong on both a month over month and a year over year basis, with supply generally holding steady from August, while being about 9% lower than in 2023. That being said, the number of current listings this September is virtually identical to September 2023, which is a testament to the lack of sitting inventory compared to last year.
While all of the numbers compare similarly to September’s of the past, September is typically a month where number of sales tends to begin it’s gradual decent downward. This year is no exception, with total number of sales down to 884 from 1030 last month. This figure is still roughly 10% higher than last year, but make no mistake, we are not about to see prices and number of sales skyrocket like it’s Winter 2020 again.
The average sale price in September was slightly down from August, this time to $410,004. This price remains below the benchmark price, and is now the second straight month of average sale price declines. This is generally an indication that the benchmark price is likely to fall in the next few months, but I believe this will only amount to a few percentage points at most.
Absorption Data:
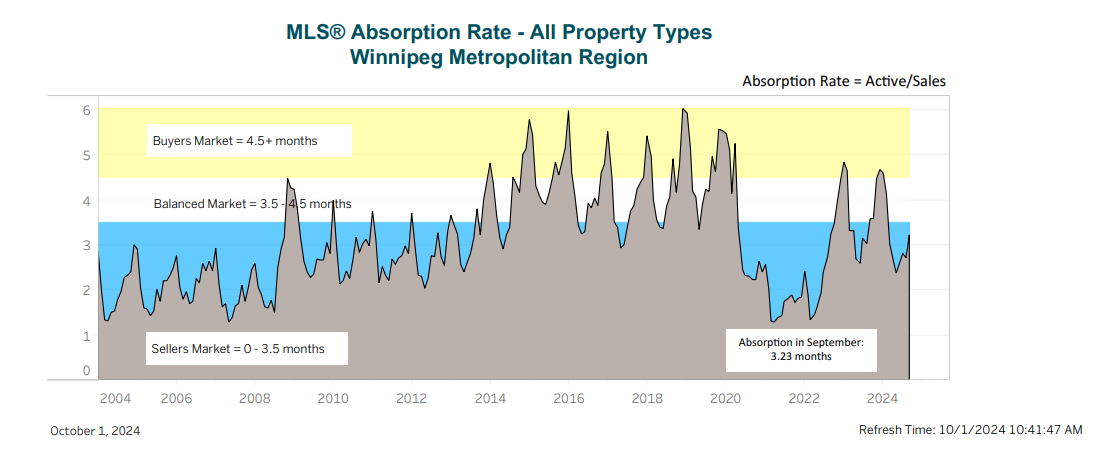
After the brief dip back in the direction of seller-favored in August, citywide absorption has returned to the general trend of moving into a generally buyer favored direction this September. This September was still far more seller-favored than many recent years, with the pandemic era being the obvious exception. Expect this line to move slightly nearer towards buyer favored as we progress through the rest of the year, but I imagine we won’t be there for long.
BIDDING WARS - OVER OR UNDER
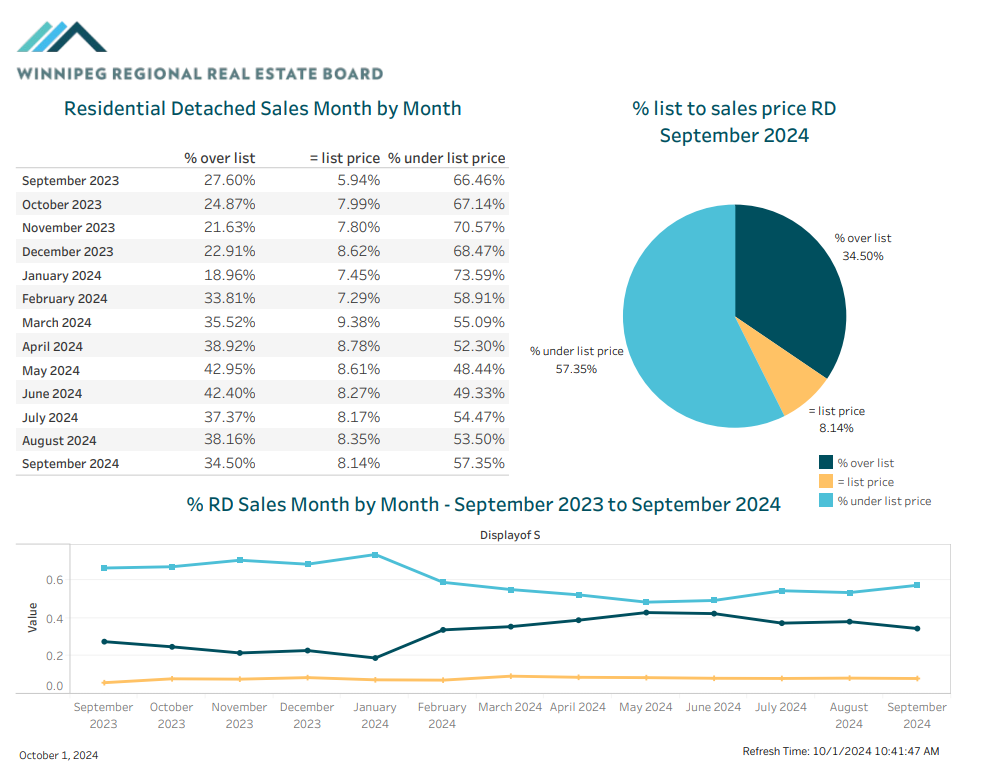
When it comes to pricing strategy, it appears the prevalence of bidding wars has remained at a level similar to the early stages of Spring, however a stark 4% fewer houses sold above asking this past month. This is almost certainly a function of sellers preparing for a less active market and pricing where they would aspire to receive in a best case scenario instead of pricing broadly and letting the market make the decision for them - which is riskier in a less active market environment. That being said, a very significant pool of the Winnipeg market is still playing the bidding war game - far more than in September 2023. I’d expect October to be a mix of both: some homes priced aggressively to sell before the snow flies, and others who have the luxury of time pricing high and letting the offers come to them when the time is right.
Authors note: the decision to execute a marketing strategy designed to yield multiple offers is a highly personal and situationally dependent decision. Before making ANY decisions regarding the pricing of property you own, or establishing an offer price for a property you wish to own, I would highly suggest you reach out to me over phone, email or DM for a free consultation on your specific circumstances. If you don’t like me personally, I have a wonderful network of skilled agents who would be more than happy to assist you in any way they can. Please do NOT take what is written here as personal advice for your specific property/situation without consulting me directly. keenan@judylindsay.com // 204-955-0173 // @keenanb_ on Instagram
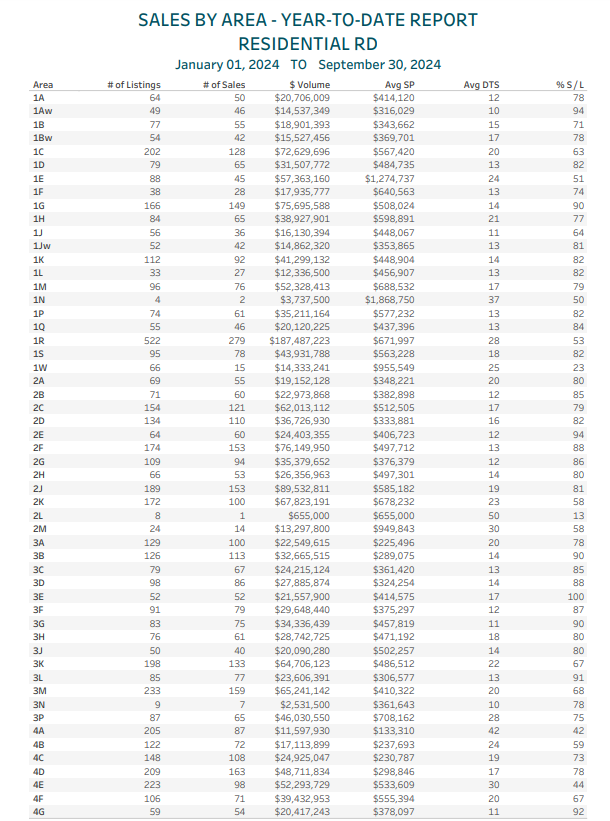
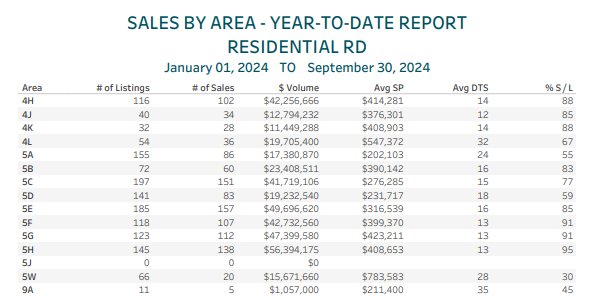
SALES BY AREA REPORT
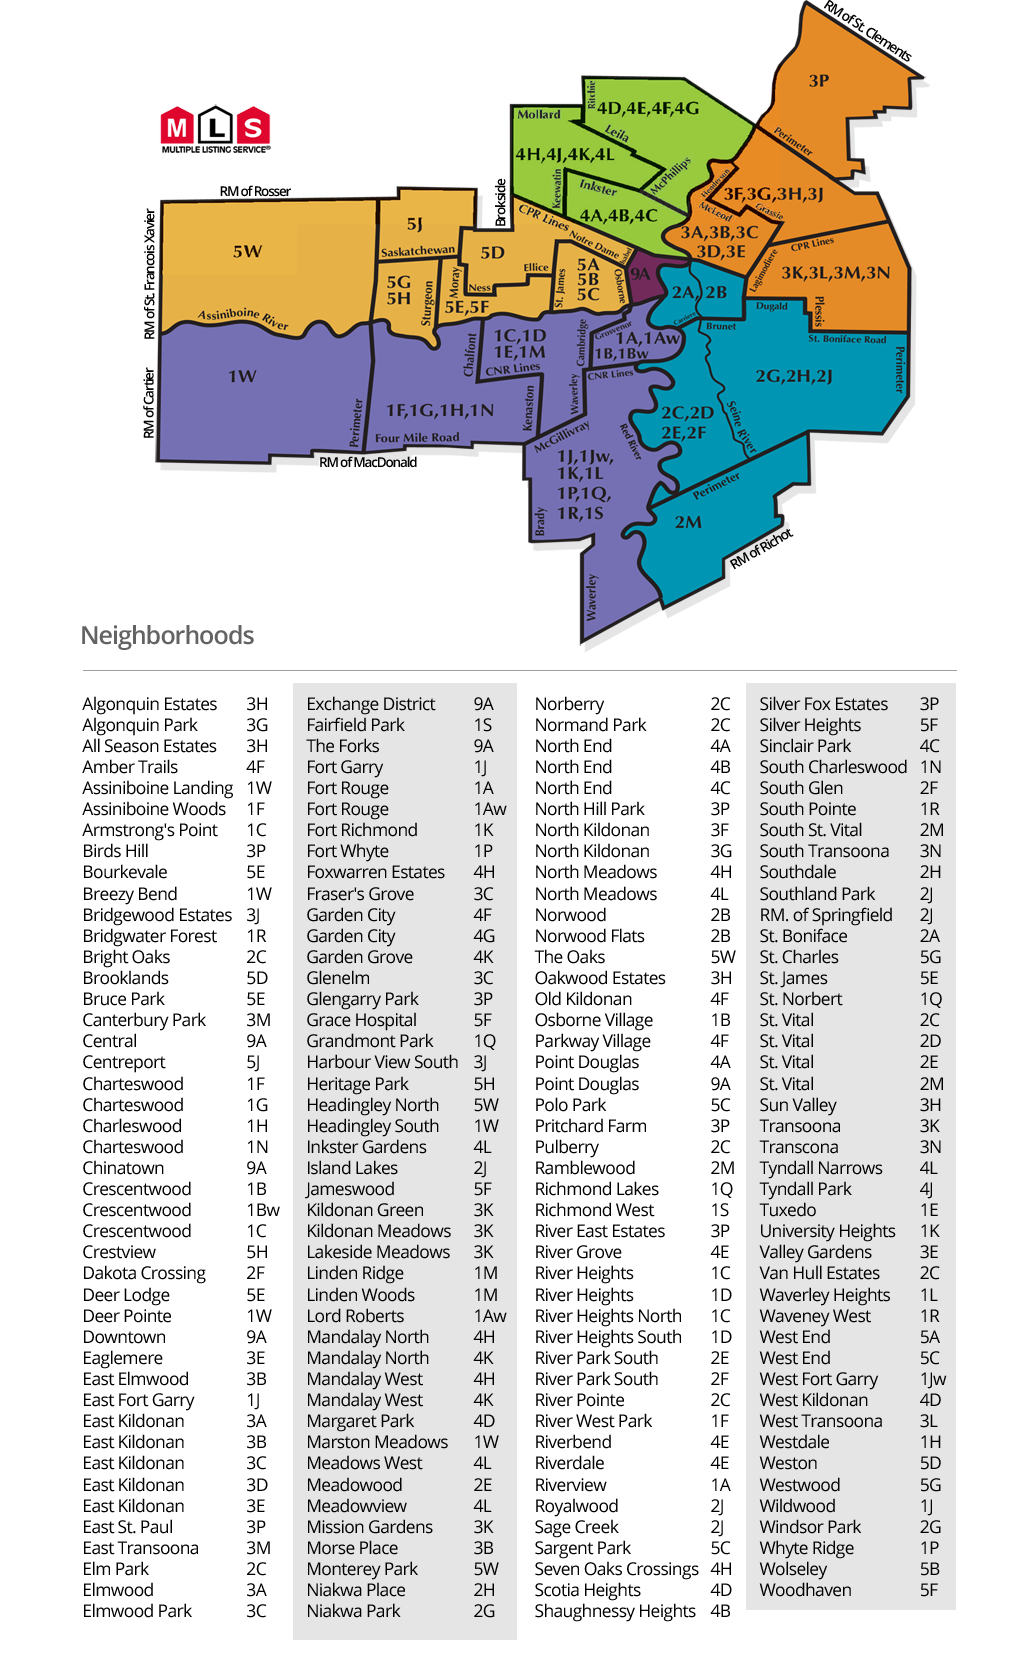
Guide on MLS area codes:
I’d classify absorption numbers as follows (From a YTD perspective):
85%+ = Extremely hot. Almost everything is selling on an offer day, not much is on the market.
70%-85% = Hot. most listings are selling, bidding wars happen, listings don’t sit long.
50-70% = Balanced. The best listings and best priced listings will sell without trouble, but greedy sellers and buyers may be in for disappointment.
35-50% = Cold. Most homes aren’t selling easily. There is likely a lot of supply on the market and most listings are stacking days on market with little attention.
< 35% = Extremely cold. The area is saturated with listings, very few properties sell quickly, very few buyers shopping in the area.
ANALYSIS
Here’s some of the hottest neighborhoods by absorption in 2024 (about 85% or higher):
1Aw - Lord Roberts - 94%
1G - Charleswood - 90%
2B - Norwood - 85%
2E - Meadowood - 94%
2F - River Park South - 88%
2G - Windsor Park - 86%
3B - Elmwood East - 90%
3C - Glenelm/Fraser’s Grove - 85%
3D - Mid Kildonan - 88%
3E - Valley Gardens - 100%
3F - North Kildonan (South) - 87%
3G - North Kildonan (North) - 90%
3L - Transcona West - 90%
4G - Garden City - 92%
4H - The Maples - 88%
4J - Tyndall Park East - 85%
4K - Tyndall Park West - 88%
5E - Saint James - 85%
5F - Silver Heights/Woodhaven - 91%
5G - Westwood - 91%
5H - Crestview - 95%
I am beginning to feel as if I’m writing virtually the same paragraph over and over once a month! The September absorption data has continued along the same lines as the last few months, with most of the really popular areas YTD remaining really popular. 3E maintained its triple digit absorption for a second consecutive month, which is truly remarkable, and many of the top MLS areas from this year are pushing closer and closer to the upper 90 percent ranges.
In terms of changes, the most noteworthy would definitely be the relative comeback of the 4 section of the city. This month marked the most dense month for Winnipeg’s North-West for some time, and areas such as The Maples, Tyndall Park and Garden city all posted fantastic numbers this month. Missing from the list but still quite strong, 4C and 4D both had impressive datasets as well.
Charleswood (1G) is at about the highest absorption level it has seen all year, which is impressive for such a geographically large MLS area. Demand in this area remains extremely high, which may be a spillover from the white hot 5E,F,G, and H areas just a short hop across the river.
Here’s a short list of neighborhoods I’m keeping a close eye on right now:
4L - Inkster Gardens - (67% this month)
This area is interesting, as it features pricing at (nearly) the all time high for the neighborhood, but also has relatively low absorption due to the mixture of new and existing construction. The area in general is very desirable, and I am curious to see how it fares late in the year. There does not appear to be a significant amount of sitting inventory, and I think these numbers can change awfully quickly.
1R - Bridgwater & extended neighborhoods (53% this month)
I am continuing to look at 1R every day, mostly to check where the “floor” is for pricing - IE: at what point does every house just sell? There is a large glut of homes in the upper end of the 600k range here, and a wide array of new builds at virtually all price points starting in the upper 400k range and going higher from there. The number of active listings is truly staggering, but a lot of the products available are new construction, and the area itself is one of the biggest MLS areas in the entire city. I still think it should be divided into at least 2 if not 3 subareas. If anyone at the board is reading this, please consider this for future years.
5C - Sargent Park and the West End (77% this month)
5C has had a generally good year, and despite the decline in the absorption numbers this month, pricing in the area has remained solid and supply is far lower than it has been as recently as last year. I am continuing to keep an eye on this area due to the significant volume of transactions I do in this end of town.
Takeaway:
Here are the key points from today’s market update:
The HPI index held flat month over month at $418,800 and remains down about 2.40% from the all-time high.
Supply metrics remained stable or improved month over month, but the average sale price and number of transactions were down month over month. The average sale price of ~410k remains below the benchmark price for the second consecutive month.
Absorption citywide remains very high, with several large chunks of Winnipeg experiencing virtually every listing selling in less than 30 days.
Despite the strong data on a seasonally adjusted basis, it is unlikely we will see a complete levelling off in pricing for the remaining three months of the year. Expect a gentle decline towards December, but be prepared for a potentially explosive Spring market in 2025!
Stay tuned for the next article, leave a comment if you found this helpful, and feel free to reach out if you would like to discuss anything in further detail.

