


Winnipeg Home Price Index Update - Data From March 2024
Q1 is in the books, and Winnipeg real estate is still on an absolute tear. Will these trends continue in Q2?
Welcome back to another market update! February is over and the number exceeded pretty much everyone’s expectations by a long shot!
A podcast version of this update will be available on Monday April 8th ! This episode will feature top producing Realtor Brent Fontaine, who has a wealth of knowledge in many facets of our local market and real estate industry in general. It’s absolutely worth the listen, check it out right here on Substack. The majority of the details and accompanying visuals will be found in the written article below for your reference. You can have these updates, other articles and podcasts emailed to you as they are released by subscribing using the link at the bottom (for free!).
March 2024 HPI Update
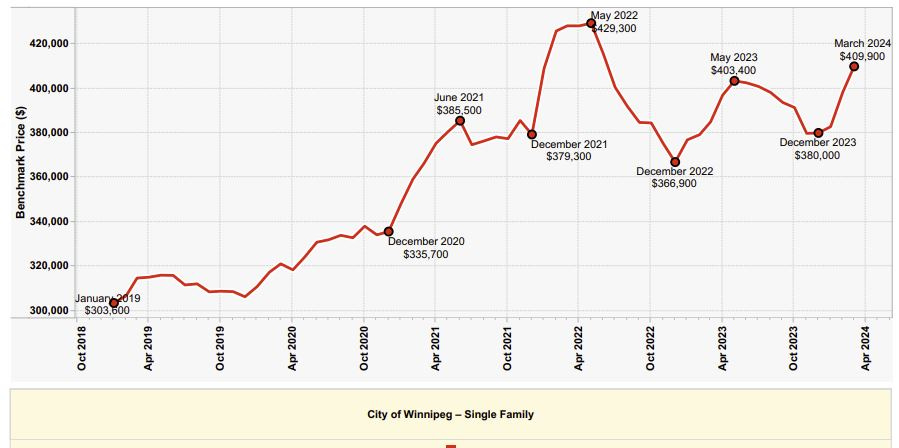
March Winnipeg Benchmark Price: $409,900 (up from December ($398,300))
Year to date: +7.87% (Was +4.82% last month)
Month over month: +2.91% (Was +4.05% last month)
From All-time High: -4.52% (Gain of +4.73% required to return to ATH from here)
The Q1 data is out, and we are facing down unbelievably strong data in almost every imaginable metric for the second consecutive month. March saw big gains in the HPI, with a solid 2.91% gain in just 31 short days. Combined with the monstrous +4.05% we experienced in February, our markets have moved ~7% in what amounts to only 60 short days. Bidding war prevalence is at the highest level its been since July 2022, supply metrics are moving towards even more seller favored, and absorption everywhere is extremely high. The question in everyone’s mind now, is how far will this trend take us, and when can we expect the reversal?
As expected, the Bank of Canada held interest rates at 5.0% in the month of March, citing generally strong economic activity nationwide, appropriate employment and falling but still-too-high inflation numbers. It is unclear if the rate cuts put on the table towards the end of 2023 will actually transpire in 2024, but at least for Winnipeg, I don’t think it particularly matters if it happens this year or next. The fact that our market was able to bring prices up just shy of 8% in 90 days with 5%+ rates, which would have been inconceivable in the pre-pandemic world, is a signal to me that we don’t need the cuts as badly as some of the larger markets in the country. My expectations for the future remain the same: Sometime in late 2024 or early 2025 a small series of rate cuts will be implemented, and our market will catapult past the all-time high in Spring 2025.
SUPPLY March 2024
February 2024 Data:
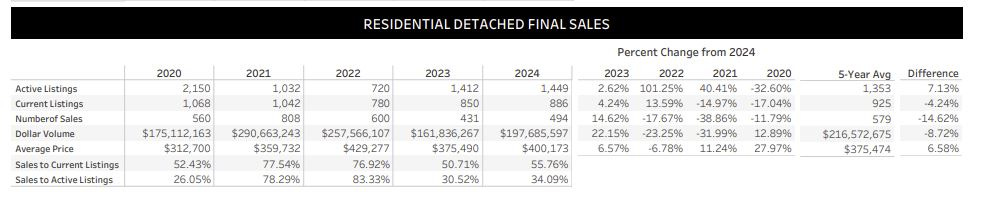
The March supply data features many of the same trends as we saw in February, except for the reasonably significant rise in number of active and current listings month over month, which is expected due to seasonality. Compared to previous years, this March looks like a more potent version of March 2023, or a slightly weaker March 2021 (which was an extremely hot time.)
We’ve kept a close eye of the average monthly sale price vs the benchmark price for the past few updates, and March continues the trend of the average sale price ($418,748) eclipsing the benchmark price ($409,900). This is a very strong indicator that prices are very likely to continue rising into the near future, especially when combined with generally seller favored supply data.
Absorption Data:
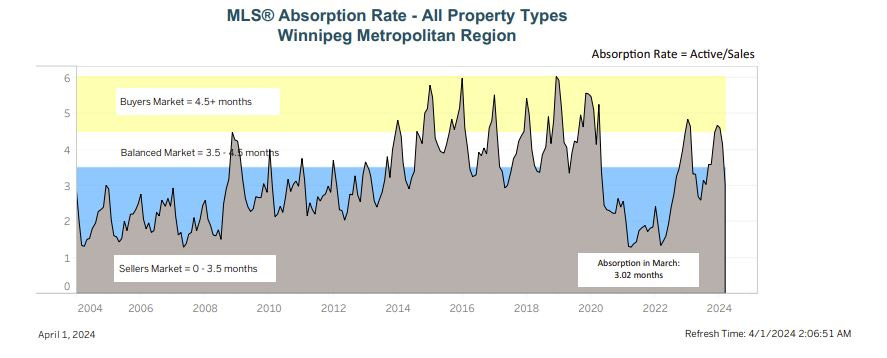
… and just like that, we’ve jumped straight back into seller’s market territory! I told you guys we wouldn’t stay in the buyer zone for too long, and this winter our stay lasted only a couple of months! I’m expecting the absorption data to continue it’s sharp move towards seller favored over the next few months, with a reversal occurring only sometime after May or June of this year.
BIDDING WARS - OVER OR UNDER
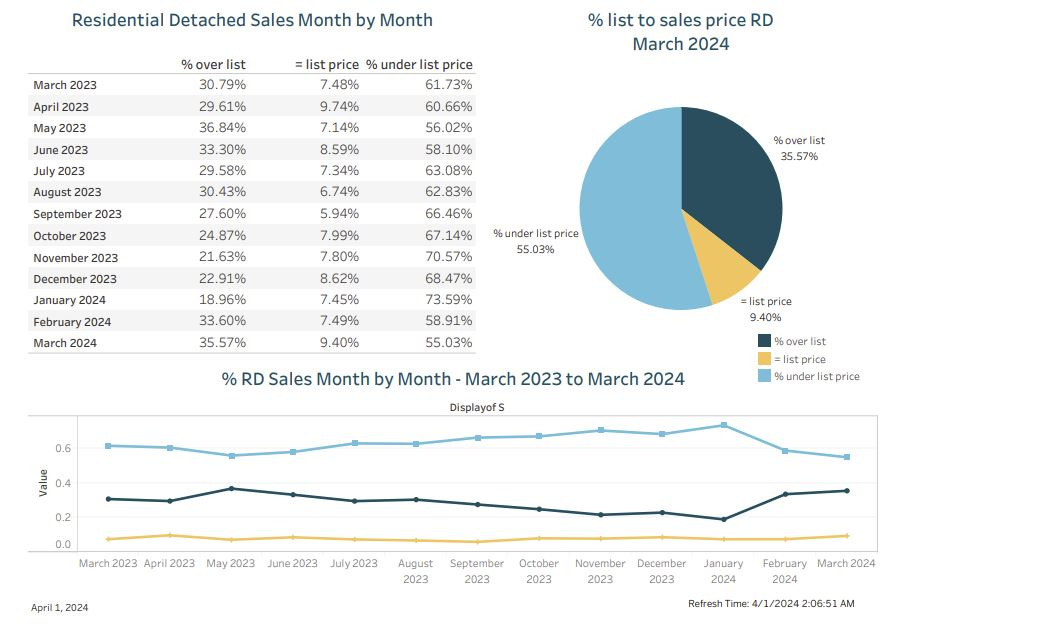
Bidding war prevalence has continued to increased in March, with roughly 45% of homes selling at or above asking price. This is the highest rate we’ve seen in Winnipeg since July 2022, which still included buyers with locked in 2 and 3% interest rates shopping at that time. As the market continues to move through the Spring, it is likely buyers, sellers and agents will come to a commensurate understanding of value and list prices will begin to more appropriately reflect the true value of properties, rather than simply listing for what would have made sense based on the mid 2023 numbers. This is especially hard for buyers, as they may be forced to use extremely limited 2024 data to justify purchase decisions, as many of the comparable sales from 2023 will no longer yield an accurate representation of what may occur after offers are submitted and bidding begins.
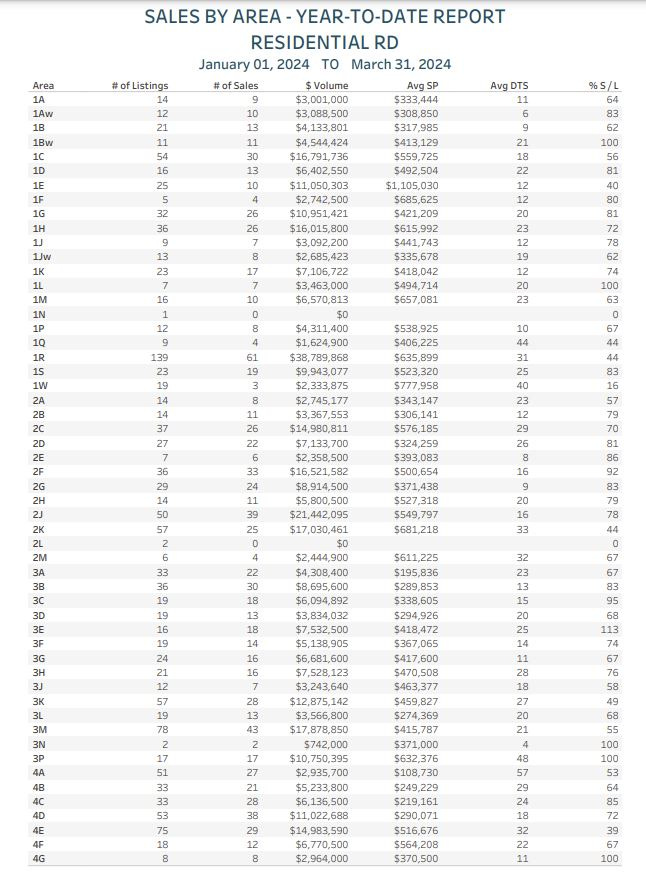
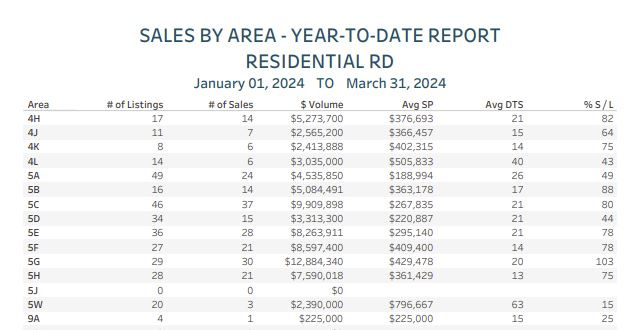
SALES BY AREA REPORT
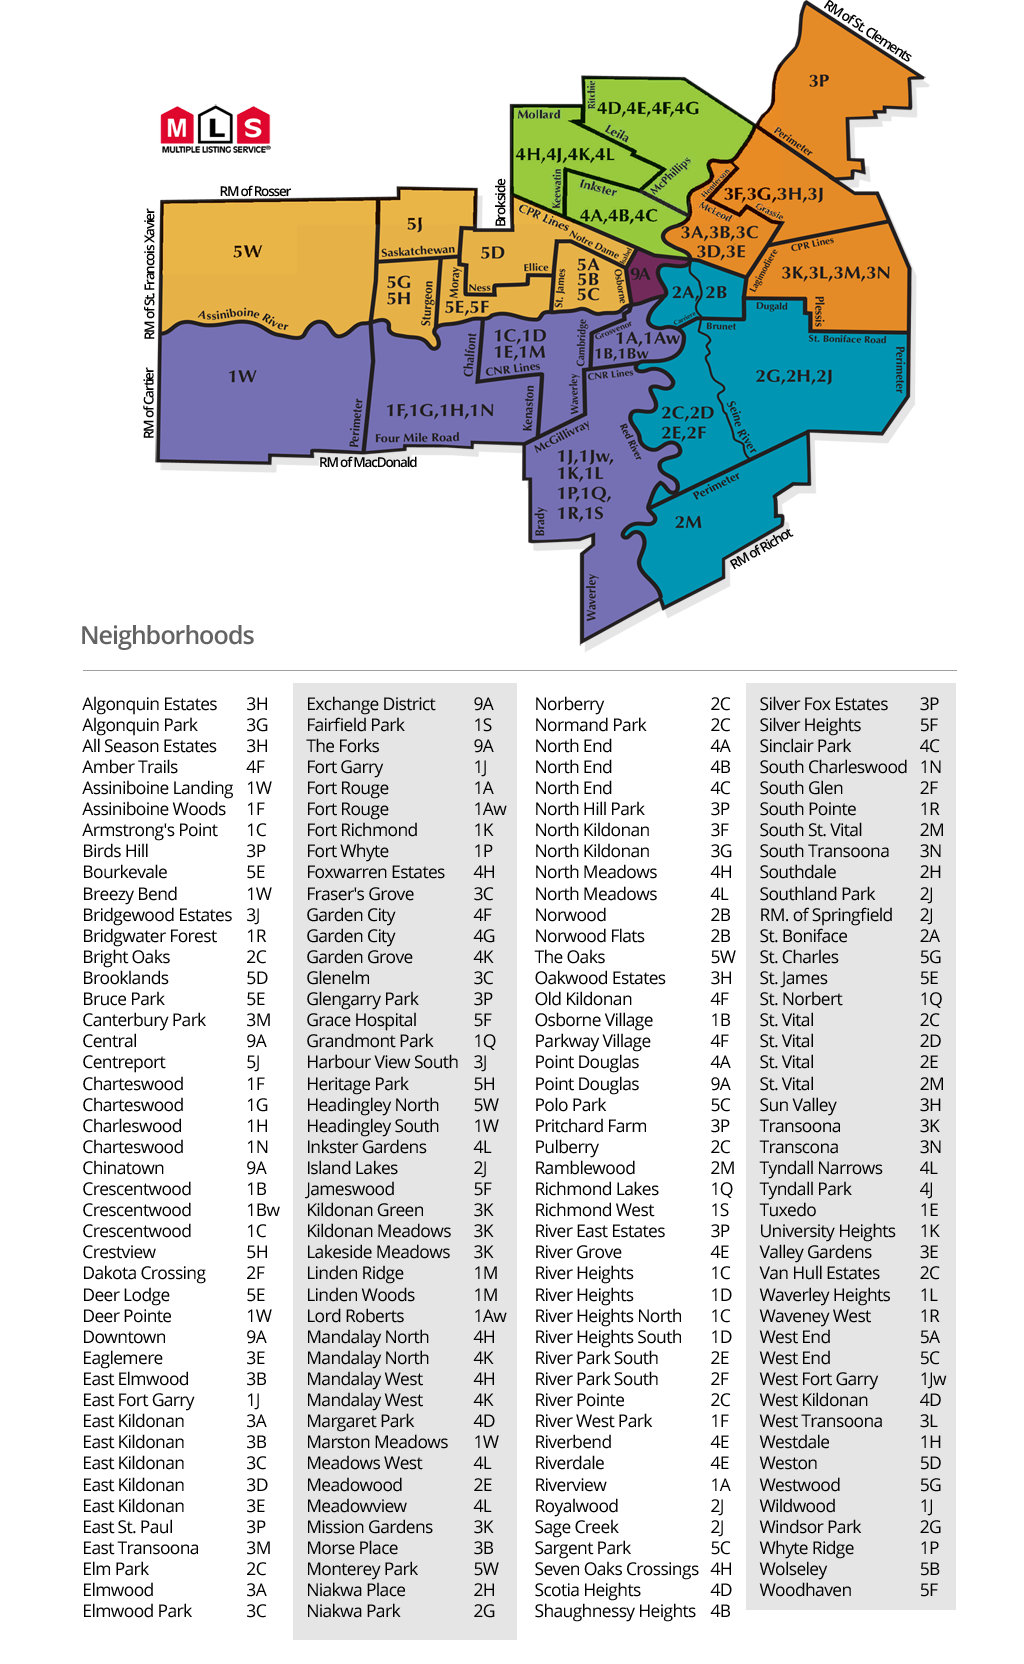
Guide on MLS area codes:
I’d classify absorption numbers as follows (From a YTD perspective):
85%+ = Extremely hot. Almost everything is selling on an offer day, not much is on the market.
70%-85% = Hot. most listings are selling, bidding wars happen, listings don’t sit long.
50-70% = Balanced. The best listings and best priced listings will sell without trouble, but greedy sellers and buyers may be in for disappointment.
35-50% = Cold. Most homes aren’t selling easily. There is likely a lot of supply on the market and most listings are stacking days on market with little attention.
< 35% = Extremely cold. The area is saturated with listings, very few properties sell quickly, very few buyers shopping in the area.
ANALYSIS
Here’s some of the hottest neighborhoods by absorption in 2024 (about 85% or higher):
3E - East Kildonan - 113%
5G - Westwood - 103%
1Bw - Crescentwood - 100%
1L - Waverley Heights - 100%
3P - East Saint Paul -100%
4G - Garden City - 100%
3C - Fraser’s Grove - 95%
2F - River Park South - 92%
5B - Wolseley - 88%
2E - South St Vital - 86%
4C - St. John’s North End - 85%
The March data shows very similar trends to the February data, with areas averaging sales prices at or below the HPI numbers generally performing very well. Several areas previously listed as “extremely hot” narrowly missed this month’s list, but have several properties on the market awaiting offer dates at the time of writing. I’d expect many of the big player areas to return to the list in the April update.
Probably the biggest shocker to me was East Saint Paul at 100% absorption after 3 months of data! This area was consistently hovering around 50% absorption for the majority of 2023, and prices appeared to be in freefall. It appears the recovery is well on the way, and the buyers have returned to the neighborhood in 2024.
East Kildonan and the nearby Kildonan areas all appear to be white hot, with absorption over 100% in 3E, and numbers in 3C-3G looking generally quite good as well. As 3E lagged behind in 2023, it makes sense to me it’s currently the hot area of the bunch while prices play catchup.
The St. Vital areas (and southwest Winnipeg in general) continued to flex their muscles in March with very good numbers across the board. Southdale and Windsor Park are very like to be featured on next month’s hot list, and I highly doubt 2E and 2F will experience a reversal this year at all. The buyer pool seems almost endless down there, and prices continue to seem reasonable.
Here’s a short list of neighborhoods I’m keeping a close eye on right now:
4D and 4C - West Kildonan/Scotia Heights/St John’s. - 72% (was 67% last month) and 85%
I am glad to see the numbers improve here, but the idea that absorption will improve once the “fixer uppers” get re-listed is still yet to play out. The average price climbed very modestly too, which was good to see. I believe this entire neighborhood section of both areas are fundamentally undervalued, and many of the stigmas and past problems they experienced years ago are more memory than reality at this point in time.
5E - St. James - 78% (was 89%)
5E is an area where I spend a ton of time, and with both active buyers and potential sellers in the neighborhood, I’ve been watching the neighborhood very closely. The absorption drop month over month is disheartening, but there are currently several properties with offer dates to come at the time of writing. I believe it’s entirely possible 5E can return to the hotlist in April, but only time will tell.
1G and 1H - Charleswood and Ridgewood West - 81% and 72%
I have several active and soon-to-be active listings in these areas, and I have absolutely scoured the data on a daily basis in both sections of these neighborhoods. I’ve been impressed by their strength so far this year, but I also know these areas can be very hard to price due to the diversity of product and the non-uniformity of the communities themselves. I believe both areas are in for very good market years this year.
1Aw - Lord Roberts - 83% (was 66%)
I was right! 6 more houses were listed in March in 1Aw, and all but 1 has sold so far. 1Aw still fits the criteria of a neighborhood that should be performing among the best in Winnipeg, and I can easily see it maintaining 80%+ absorption for the full year.
Takeaway:
Here are the key points from today’s market update:
The HPI index rose 2.91% month over month, up to $409,900 and down about 4.52% from the all-time high.
Supply metrics continue to trend strongly in a seller favored direction, with many neighborhoods experiencing extremely low listing activity. The market has officially entered “seller favored” territory and appears to be moving further into that zone.
Bidding war prevalence has increase once again! ~45%+ detached homes in Winnipeg sold at or above asking price in March 2024, which is the most since July 2022.
The most popular price points in March remain the 300-350k, and 400-500k ranges. The more expensive neighborhoods are likely to be next, as the 500k sellers will (on many occasions), upsize.
Stay tuned for the next article, leave a comment if you found this helpful, and feel free to reach out if you would like to discuss anything in further detail.