


Winnipeg Home Price Index Update - Data From AUGUST 2024
With even more potential interest rate cuts on the table and the 2024 season approaching its finale, what will the Winnipeg real estate market do to close out the year?
A podcast version of this update will be available during the week following Sunday Sept 8th, which will feature our first ever return guest - Brent Fontaine. As always, if you find these updates helpful, please subscribe (it’s 100% free and always will be!)
AUGUST 2024 HPI Update
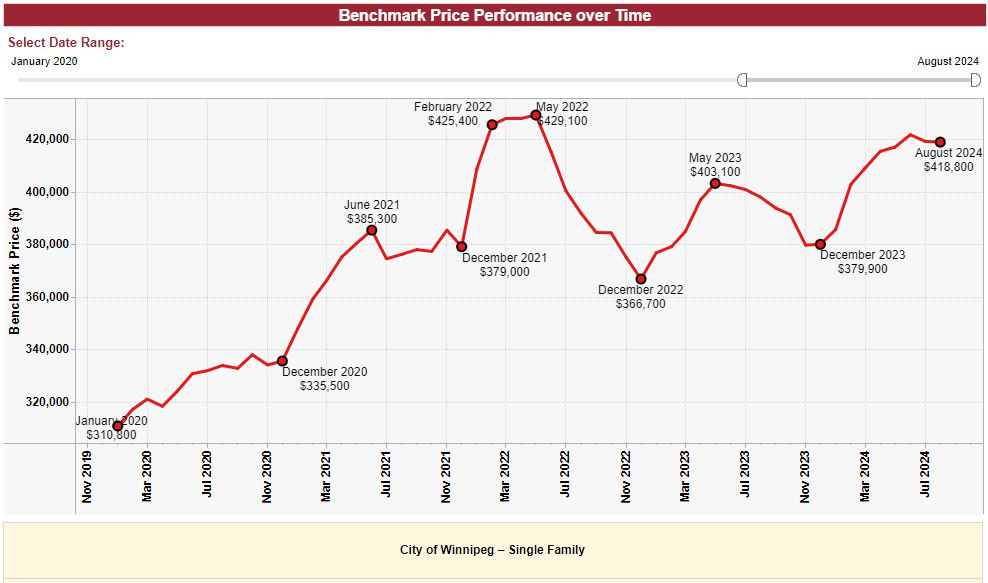
August Winnipeg Benchmark Price: $418,800 (down from $419,100 in July))
Year to date: +10.24% (Was +10.45% last month)
Month over month: -0.07% (Was -0.47% last month)
From 2024 High: -0.66%
From All-time High: -2.40%
With August in the books, and serious talks of a half point interest rate cut, the Winnipeg real estate market is holding incredibly steady! With supply declining slightly, and transaction volume remaining high compared to previous years, the market seems to be poised to enter the slow season with strength relative to recent history. Citywide pricing remains relatively consistent with our 2024 high, and the market in general remains easily within 3% of the May 2022 all-time high.
As most long-time readers are aware, historically speaking, the entire Winnipeg real estate market behaves in a very seasonal and cyclical manner. Most years, our market tends to move in directions generally favorable to sellers from January to ~July, and tends to flatline throughout the summer before becoming buyer favored in the Fall and Winter months.
Many other Canadian cities follow a very similar pattern, however the price points and makeup of the larger markets can cause some significant deviation in price action and transaction volume.
For what feels like the first time in several years, Winnipeg’s 2024 market activity has seemed almost astoundingly normal. We saw impressive price gains in the Spring, cresting in early summer, and flatlining in towards the end of the summer season. Typically, we would expect a pullback of 1/2 to 3/4 of our Spring gains as we head towards the new year, but something feels different about this time.
I specifically aim to avoid discussing Toronto and Vancouver real estate, as it is not my area of expertise, and it is only occasionally of consequence to our Winnipeg market, but this Fall is certainly different, and I simply must discuss Canada’s larger markets in order to understand what may/may not happen with Winnipeg in the near future.
Here’s a snapshot of the Greater Toronto Area benchmark price:
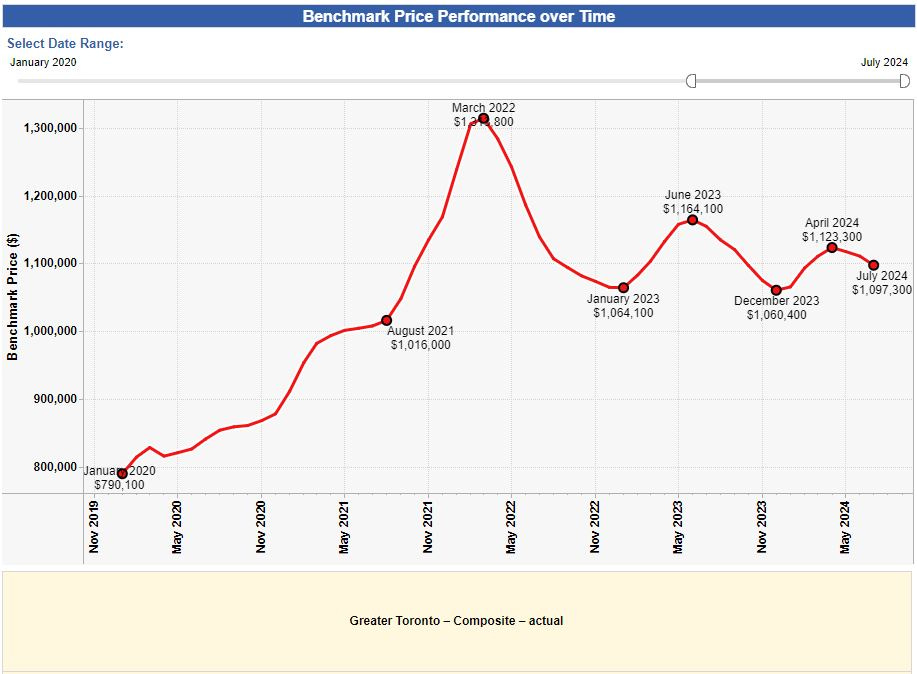
The GTA market is not only down nearly 16.5% from the all-time high, but the pricing in 2024 has failed to clear the 2023 highs as well. Additionally, while the Winnipeg market appears to have levelled out for the season, the GTA peaked all the way back in April, and appears to be on track to fall towards the winter lows of 2022 and 2023.
This price action and these losses (whether realized or not) are among the pieces of the puzzle considered by governments and central banks when making decisions regarding the direction of interest rates and their potential impact on real estate pricing. As far as I am aware, I do not believe they’ve ever once pulled up the Winnipeg HPI chart.
Given the pain many owners have experienced in some of Canada’s more expensive markets, many pundits have been inclined to believe more significant action is on the way, possibly as early as Sept 4th. Considering the position of the Winnipeg market, it is hard to argue our small city is in desperate need of the steroid that would be another series of interest rate cuts, but the decision makers do not consider us when deciding these matters.
For that reason, the remaining 4 months of the year can end up being very interesting for Winnipeg - it’s improbable, but certainly possible to see pricing move unpredictably and erratically as we move towards the end of the year. My 2022 prediction of the Winnipeg benchmark returning to the all-time high during the 2025 calendar year also remains a very realistic possibility.
SUPPLY August 2024:
July 2024 Data:
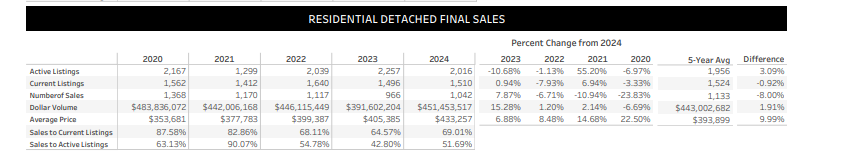
August 2024 Data:
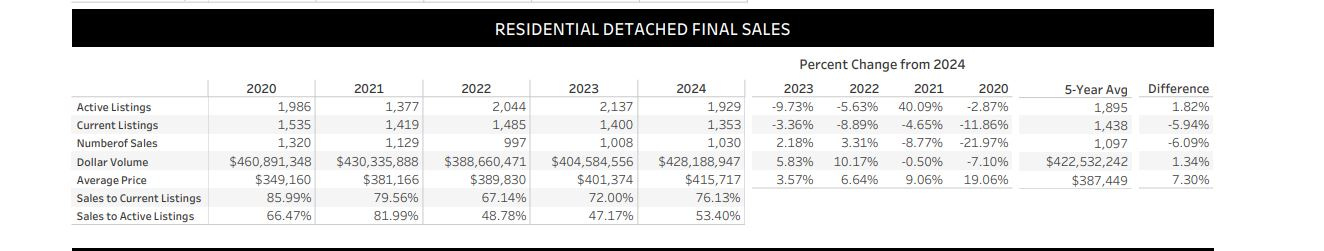
Once again, we have another month of supply data with only a few small changes from the month prior. This time, supply overall is steady and transaction volume is steady, but dollar volume and average pricing has slipped. for the first time in several months, the average sale price fell below the benchmark price, which is a strong indication prices are likely to fall on the chart in the next several months. Due to seasonality, this is a pretty standard expectation considering the time of year, but considering the likely central bank intervention forthcoming, this may or may not occur any time soon, or possibly even at all.
Compared to previous years, this August has surpassed both 2023 and 2022 in most metrics, and surpassed 2020 and 2021 in all categories besides number of sales and transaction volume. This data should be a good signal to confirm the relative strength of our market and the overall likelihood of 2023/2024 prices being the “new normal” heading towards the future.
Absorption Data:
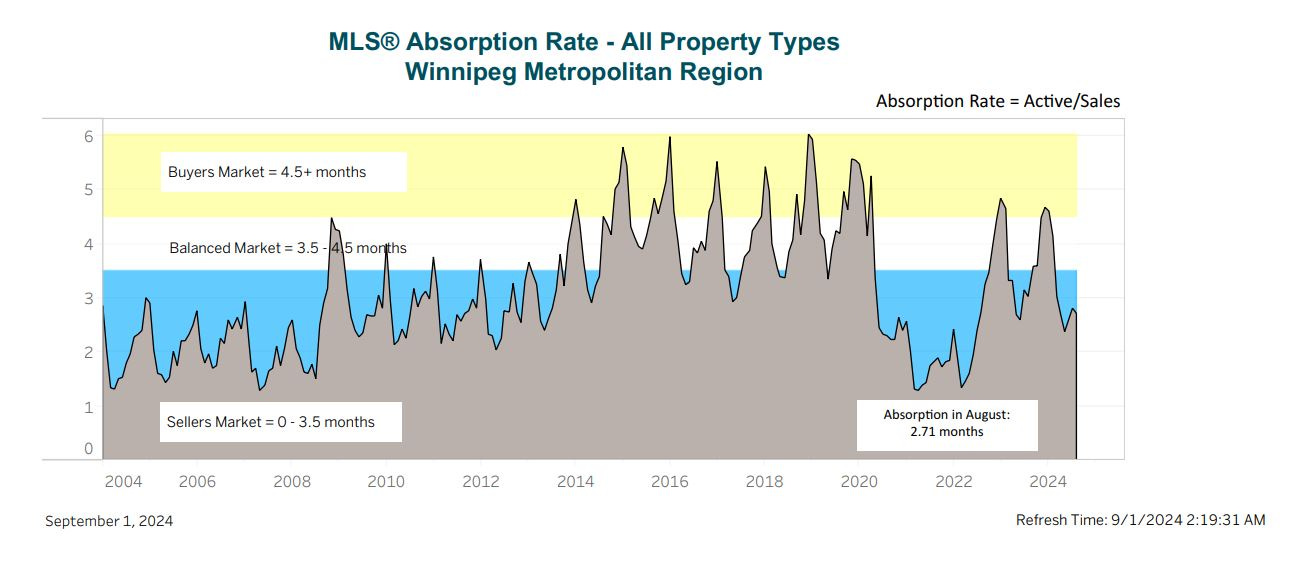
The August absorption data took a surprising turn back towards the Seller favored side of the chart. In the context of an essentially flat benchmark price, and lower supply than the previous month, this isn’t completely out of left field; however, the timing of this turn is not normal for this time of year. It’s data points like this one leading me to believe we may deviate from our seasonal standards and see some surprising upward/flat movement at times where our benchmark is supposed to fall as we head into the last few months of the year.
BIDDING WARS - OVER OR UNDER
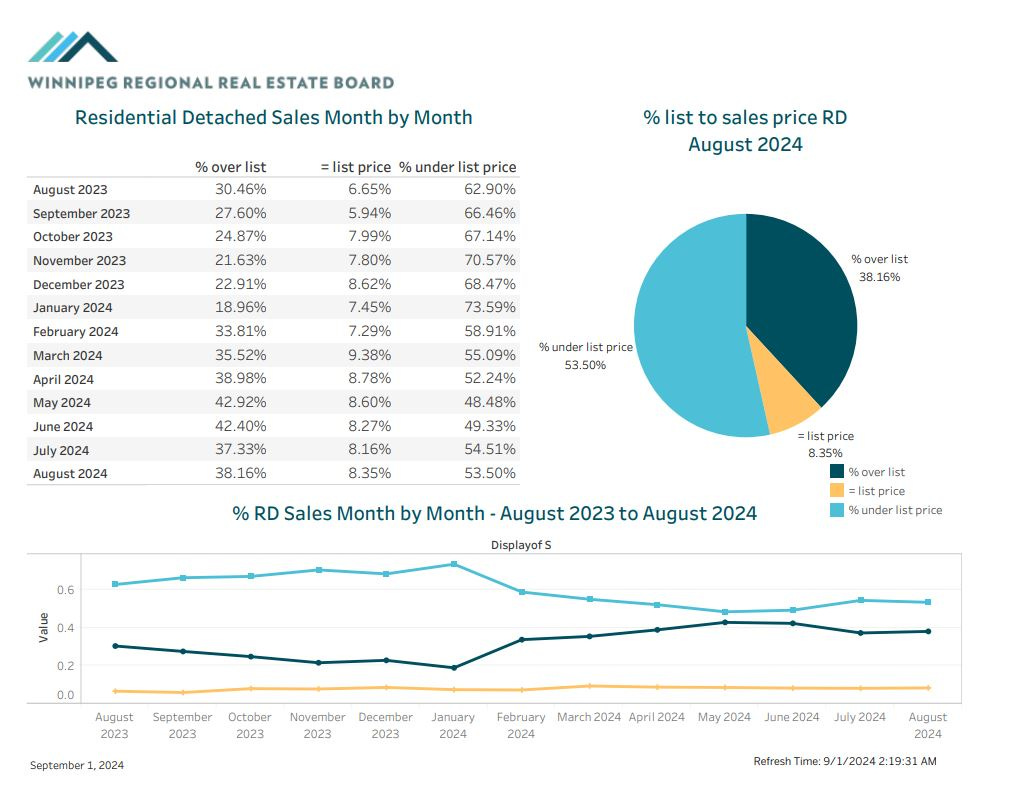
When it comes to pricing strategy, it appears the prevalence of bidding wars continues to remain high citywide. With supply at best remaining constant, and several MLS areas having consecutive 90%+ months of absorption, it should come as no surprise to see sellers and listing agents opting for more aggressive strategies to yield multiple offers in this late stage of the year. The high level of homes selling precisely at list price is a good indicator of the overall urgency on the buyside in our market - 8.35% of purchasers aren’t willing to risk getting bumped into multiple offers by writing low in a 1-on-1 negotiation, which is, in my opinion, a lot.
The decision to execute a marketing strategy designed to yield multiple offers is a highly personal and situational decision. Before making ANY decisions regarding the pricing of property you own, or establishing an offer price for a property you wish to own, I would highly suggest you reach out to me over phone, email or DM for a free consultation on your specific circumstances. If you don’t like me personally, I have a wonderful network of skilled agents who would be more than happy to assist you in any way they can. keenan@judylindsay.com // 204-955-0173 // @keenanb_ on Instagram
SALES BY AREA REPORT
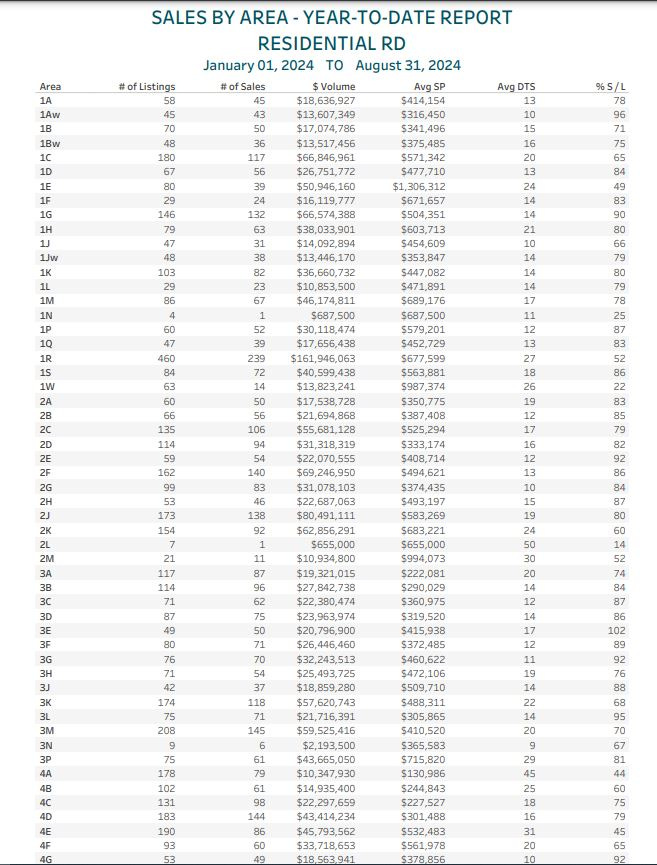
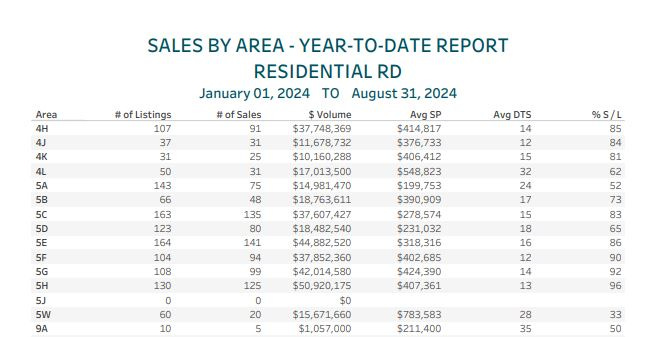
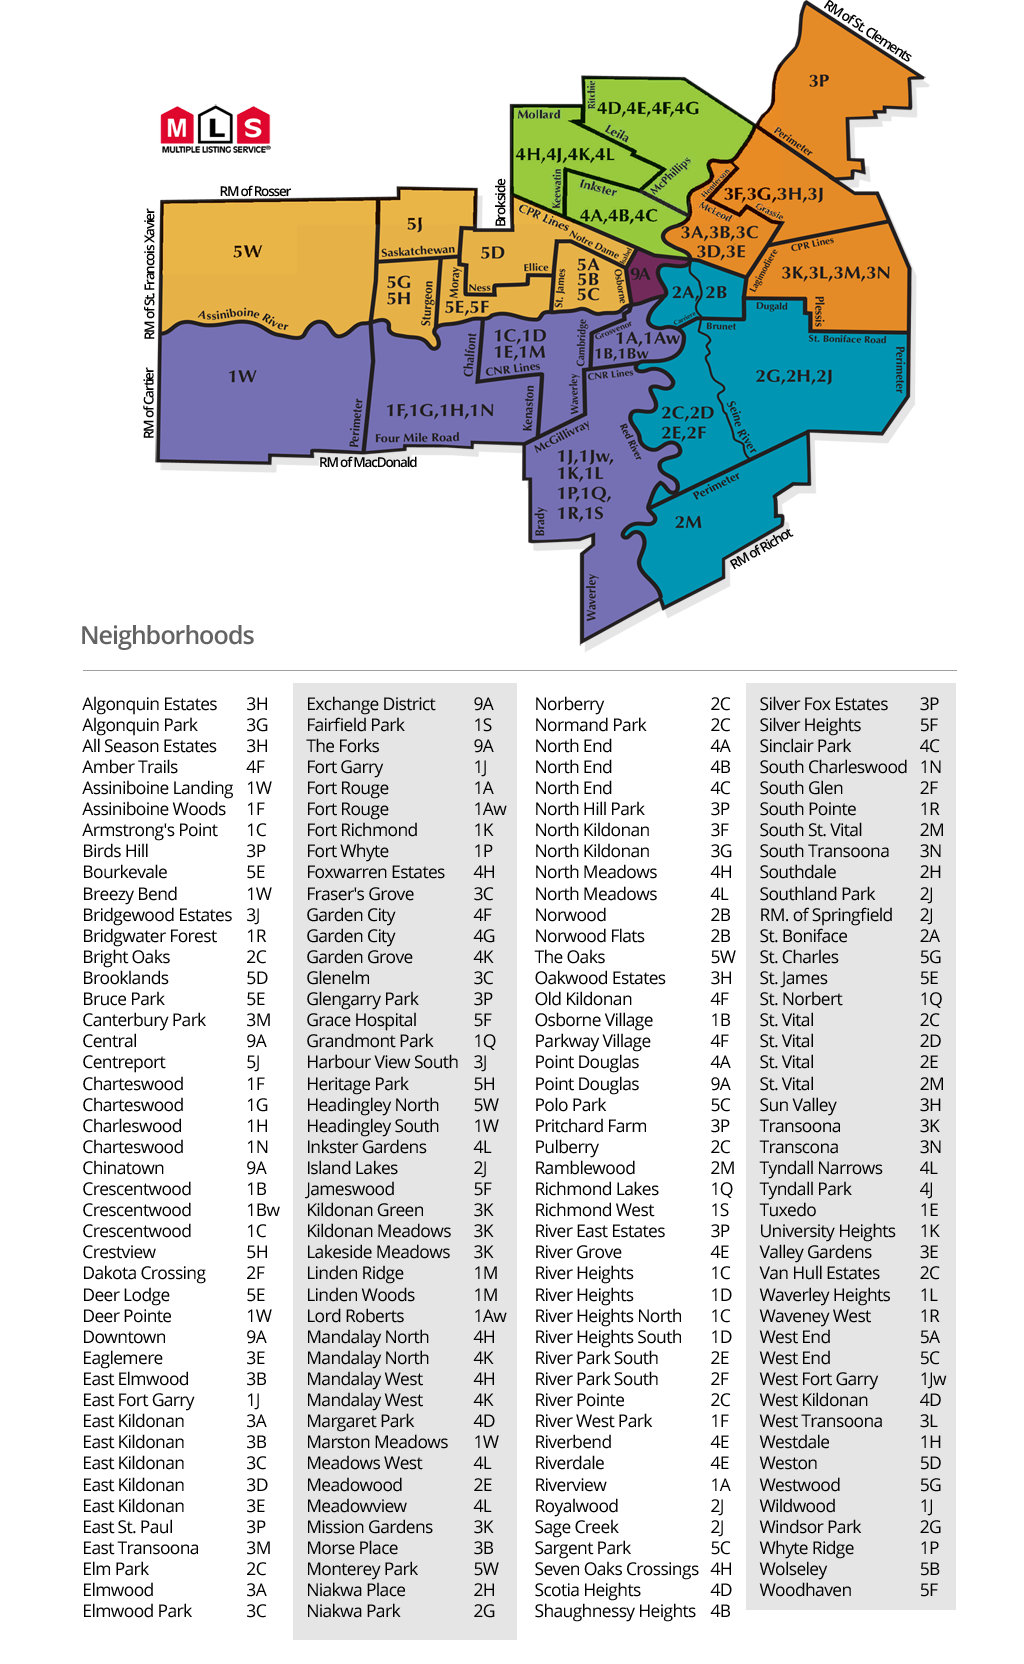
Guide on MLS area codes:
I’d classify absorption numbers as follows (From a YTD perspective):
85%+ = Extremely hot. Almost everything is selling on an offer day, not much is on the market.
70%-85% = Hot. most listings are selling, bidding wars happen, listings don’t sit long.
50-70% = Balanced. The best listings and best priced listings will sell without trouble, but greedy sellers and buyers may be in for disappointment.
35-50% = Cold. Most homes aren’t selling easily. There is likely a lot of supply on the market and most listings are stacking days on market with little attention.
< 35% = Extremely cold. The area is saturated with listings, very few properties sell quickly, very few buyers shopping in the area.
ANALYSIS
Here’s some of the hottest neighborhoods by absorption in 2024 (about 85% or higher):
1Aw - Lord Roberts - 96%
1G - Charleswood - 90%
1P - Whyteridge - 87%
1S - Richmond West - 86%
2B - Norwood - 85%
2E - South St Vital - 92%
2F - River Park South - 86%
2H - Southdale - 87%
3C - Fraser’s Grove - 87%
3D - Mid Kildonan - 86%
3E - Valley Gardens - 102% !!
3F - North Kildonan (River East) - 89%
3G - North Kildonan (North) - 92%
3J - Harbor View - 88%
3L - Transcona West - 95%
4G - Garden City - 92%
4H - The Maples - 85%
5E - St James - 86%
5F - Silver Heights/Woodhaven - 90%
5G - Westwood - 92%
5H - Heritage Park/Crestview - 96%
Another month has passed, and so little has changed! August has continued the trend of absolute dominance of the 3 and 5 beginning MLS areas featuring some pretty extreme overall. Check out the 102% absorption in 3E - truly shocking to see in a month as late as August! The north east and westmost MLS areas have experienced severe buying pressure nearly all year long. Upon further analysis into each individual area HPI, some of these neighborhoods have yet to experience a decline in their individual HPIs, and many of them are at, or incredibly close to their all-time highs.
Citywide, most of the areas which didn’t make it onto this month’s shortlist are still experiencing strong demand. Most conventional areas (non inner city and non-new build dominated areas) are still hovering between 70 and 80%, which is a very strong rate at this late stage in the year. After reviewing this data, the citywide seller favored absorption moved makes significantly more sense to me.
Here’s a short list of neighborhoods I’m keeping a close eye on right now:
1E - Tuxedo (49% this month)
For the same reason as last month, I am still keeping a close eye on 1E in hopes I can divine some wisdom from the moves of Winnipeg’s most expensive MLS area. In the event we get the heavily anticipated .5% rate cut this week, it might be interesting to see if absorption/liquidity of these beautiful expensive homes improves for the benefit of the sellers. I continue to watch as a litmus test for the rest of the city and the high end market in general.
1R - Bridgwater & extended neighborhoods (52% this month)
I certainly do not typically spend a lot of time in 1R, but I currently have at least one active buyer considering the area as well as an early 2025 listing queue’d up for the new year. I’m taking some time to learn and analyze the supply picture, the dynamic of new build activity vs existing construction, and the absorption differences between the older and the newer stock within each subarea. Honestly, I think 1R is probably at the size where it will need to be cut into at least one other MLS area relatively soon. This is a fascinating chunk of our city to look at, and I am very curious to see how the remainder of 2024 plays out for this oversized MLS area.
5C - Sargent Park and the West End (83% this month)
5C had another solid month of activity, and ended up in essentially the same spot as the last couple of months: strong, but not eye-popping absorption, and a benchmark price plateauing around the yearly high of ~$267k. With prices the way they are, and the activity as high as it is, it’s looking like 5C may be in for a less dramatic pullback in the winter months than we’ve seen these last couple of years.
Takeaway:
Here are the key points from today’s market update:
The HPI index fell 0.07% month over month, to $418,800 and is down about 2.40% from the all-time high.
Supply metrics remained stable or improved month over month, with the average sale price slipping slightly below the current citywide benchmark price.
Absorption citywide remains very high, with several large chunks of Winnipeg experiencing virtually every listing selling in less than 30 days.
With most expecting rate cuts for the benefit of Canada’s larger markets, Winnipeg real estate is in a healthy position and stands to only gain from increased access to credit on the buy side.
Stay tuned for the next article, leave a comment if you found this helpful, and feel free to reach out if you would like to discuss anything in further detail.